Download
1 / 3
30 likes | 194 Views
Table 1. Human control and osteoporotic (OP) patients. Mean values (±SD) for the Vickers microhardness (Hv). the degree of mineralization of bone (DMB) and the heterogeneity index of the distribution of DMB (HI). Humans patients. Total bone tissue. Cortical bone tissue.

E N D
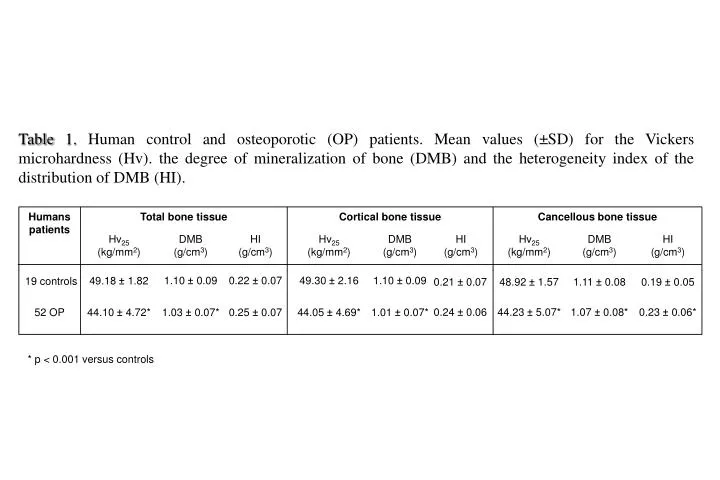
Table 1. Human control and osteoporotic (OP) patients. Mean values (±SD) for the Vickers microhardness (Hv). the degree of mineralization of bone (DMB) and the heterogeneity index of the distribution of DMB (HI). Humans patients Total bone tissue Cortical bone tissue Cancellous bone tissue Hv25 (kg/mm2) DMB (g/cm3) HI (g/cm3) Hv25 (kg/mm2) DMB (g/cm3) HI (g/cm3) Hv25 (kg/mm2) DMB (g/cm3) HI (g/cm3) 1.10 ± 0.09 0.22 ± 0.07 49.30 ± 2.16 1.10 ± 0.09 49.18 ± 1.82 19 controls 0.21 ± 0.07 48.92 ± 1.57 1.11 ± 0.08 0.19 ± 0.05 0.24 ± 0.06 44.23 ± 5.07* 1.07 ± 0.08* 0.23 ± 0.06* 52 OP 44.10 ± 4.72* 1.03 ± 0.07* 0.25 ± 0.07 44.05 ± 4.69* 1.01 ± 0.07* * p < 0.001 versus controls
Interstitial bone Recent BSU Figure 1
70 65 60 55 50 Microhardness of bone (kg/mm2) 45 40 35 30 0.60 0.70 0.80 0.90 1.00 1.10 1.20 1.30 1.40 1.50 Degree of mineralization of bone tissue (g/cm3) Figure 2
