Download
1 / 31
310 likes | 532 Views
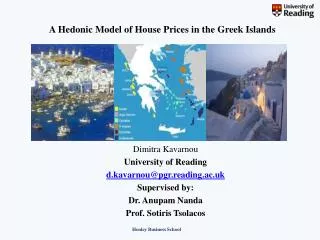
Integrating Land Use in a Hedonic Price Model Using GIS . URISA 2001 Yan Kestens Marius Thériault François Des Rosiers Centre de Recherche en Aménagement et Développement Laval University, Québec, Canada. Presentation Outline. Introduction Objective Method Results Conclusion.

E N D
Integrating Land Use in a Hedonic Price Model Using GIS URISA 2001 Yan Kestens Marius Thériault François Des Rosiers Centre de Recherche en Aménagement et Développement Laval University, Québec, Canada
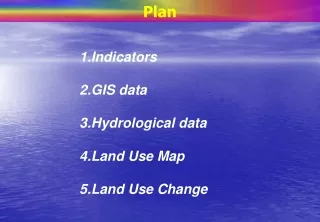
Presentation Outline • Introduction • Objective • Method • Results • Conclusion
Introduction - Achieving a better understanding of the spatial and temporal dynamics of the Quebec City Region - Hedonic Modeling using an important database describing over 30,000 transactions covering the 1986-1996 period - Integrating land use characteristics using GIS
Additive form: Sale price = 0+1Var1+ 2Var2+…+nVarn+ Multiplicative form: Introduction What is Hedonic Modelling? • Method based on multiple regression analysis (MRA) • Calculate the specific contribution of an attribute • Explanatory power • Predictive power
Modelling Databases Statistical Techniques GIS Introduction • A largely used method in property assessment: CAMA What is Hedonic Modelling? • Which has taken advantage from the development of computer technology and the GIS domain
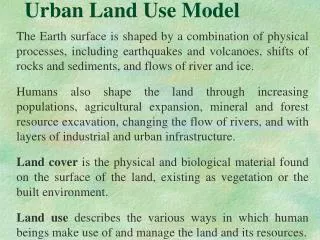
Introduction Model specifications: the explanatory variables • Property-specific attributes (living area, lot size, nb of bathrooms, etc.) • Socio-economic attributes (census data) • Location (Euclidean distance to externalities) • Accessibility (car travel time/distance to services, etc.) • Environmental attributes (noise, vegetation, view, etc.)
Previous Work • Numerous hedonic models but only few of which integrate the environmental dimension • Those few hedonic models which do integrate environmental dimensions use variables resulting from ground surveys which are money- and time-consuming • Sight is the most important sense in our sensitive experience with our environment • Vegetation has an overall positive impact on preference • The environmental dimension plays a significant role in the determination of house prices
Previous Work • Morales 76: Manchester, Connecticut: +6 to 9% for houses with a good tree cover • Seila et al. 82: +7% for new built houses with trees • Anderson and Cordell, 88, Athen, Georgia, +3 to +5% for houses with trees • Luttik 2000; 8 cities in the Netherlands, positive impact of green areas and presence of trees significant in 2 cities out of 8 : +7 and +8% on sale price. • Dombrow et al. 2000; positive contribution of the presence of mature trees of +2%.
Previous Work • Criticism: method of data collection • on-field surveying of the properties • use of front view photographs • Consequence: biases • bias related to subjectivity of surveyors • bias related to fraction of vegetation from only one point of view
Previous work Quebec City Region • Impact of high-voltage power lines, schools, shopping centers, landscaping attributes • Explorations with GIS tools and statistical methods: PCA, Trend Surface Analysis, Kriging techniques, Spatial Autocorrelation measures, interactive variables. • However, significant spatial structure in residuals.
Objective • Improving the hedonic price models by adding environmental data • Improving the explicative and predictive power of the models • Reducing heteroskedasticity and spatial autocorrelation in the residuals • Using an inexpensive and efficient method to obtain data for the whole area of study: using GIS tools
Method DataModelling procedure n=1,392 Sub-sample of 10% Range: $50,000-$250,000 Mean price: $112,000
Method DataModelling procedure • 75 physical attributes • 36 census variables • 14 location variables • 40 accessibility estimators • 48 environmental variables • Over 1,400 potential interactive variables
Method DataModelling procedure • Extraction of land use information using color areal photographs • continuity • availability • low price
Method DataModelling procedure • 124 areal color photographs covering the area of study
Method DataModelling procedure • Scanning: raster images • Spatial referencing using road network, hydrology and buildings from topographic map (Geographic Transformer) • Building of a mosaic (Arc View)
Method DataModelling procedure • Categorization using ISODATA technique • Tree coverage • Lawn surfaces • Barren land • Mineral surfaces
Method DataModelling procedure • Computing of land use information using buffer functions
Method DataModelling procedure • Multiplicative form, explained variable Ln of selling price • Three steps*: • Model A: Property-specific attributes • Model B: location, accessibility and census variables added • Model C: land use data added * Regression specification: OLS, stepwise procedure • Controlling for multicolinearity (VIF), spatial autocorrelation (I of Moran), heteroskedasticity (Goldfeld-Quandt test).
Results Model AModel BModel C Spatial Autocorrelation
Results Model AModel BModel C Spatial Autocorrelation
Results Model AModel BModel C
Results Model C
Results Model AModel BModel C Spatial Autocorrelation
Results Validation • Validation of the final model with the sub-sample of 10% • Adj. R-square: 0.829 • Std. Error of estimate: 0.159 • Calculated predicted error of 10.9%
Results Effect of Barren land cover in a 100 m radius • Lawn in poor condition increases the feeling of insecurity (Kuo 1998)
Results Effect of Tree vs Mineral cover in a 80 m radius • Negative effect of trees at a local scale for aged population • Positive effect of trees at a local scale for younger population • In accordance with previous findings by Des Rosiers et al. (2001)
Results Effect of an attached garage considering lawn area in a 500 m radius
Conclusion • Model performance: slight increase in explained variance, but important drop of spatial autocorrelation • Use of interactive variables: the effect of an environmental attribute is not constant over space • Use of areal photographs integrated in a GIS proved to be efficient and low cost
Integrating Land Use in a Hedonic Price Model Using GIS URISA 2001 Yan Kestens Marius Thériault François Des Rosiers Urban and Regional Planning Research Centre Laval University, Québec, Canada
Results Effect of Time Distance considering lawn areas in a 300 m radius and vegetation cover in a 60 m radius