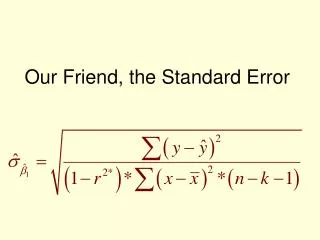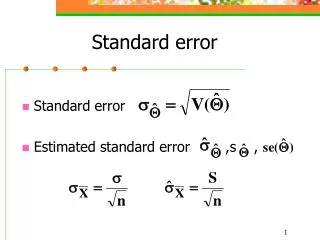
Bootstrap-based standard error for DETECT
350 likes | 558 Views
Bootstrap-based standard error for DETECT. EunYoung Lim University of Illinois Louis Roussos Measured Progress. IDEA. Estimating standard error for DETECT Statistics. How can we estimate them?. Why do we want to know SE?. Insight for bias. Bootstrap re-sample. DETECT.

Bootstrap-based standard error for DETECT
E N D
Presentation Transcript
Bootstrap-based standard error for DETECT EunYoung Lim University of Illinois Louis Roussos Measured Progress
IDEA Estimating standard error for DETECT Statistics How can we estimate them? Why do we want to know SE? Insight for bias Bootstrap re-sample
DETECT • Dimensionality Evaluation To Enumerate Contributing Traits • Conditional Covariance Based Nonparametric Multidimensionality Assessment • Searching for the clusters that maximize the DETECT estimator
i4 i1 i6 i3 i2 i5 i4 i1 i6 i3 i2 i5 How DETECT searches the clusters? Signs of CCOV Matrix i1 i2 i3 i4 i5 i6 i1 i2 i3 i4 i5 i6 Genetic Algorithm
DETECT statistics • DETECT estimator • IDN index • Ratio r
1, if item Xi1and Xi2 are in the same cluster of P -1, otherwise Theoretical DETECT parameter • n= no. of items • P is any partition of a test.
1, if item Xi1and Xi2 are in the same cluster of P -1, otherwise The DETECT estimator • n= no. of items • P is any partition of a test.
Training Sample (TS) Cross Validation Sample (CVS) Clusters Get Statistics No of clusters Items in each cluster DETECT output How to get DETECT statistics? DATA DETECT estimator IDN INDEX Ratio r
D0 Bootstrap methods Get DETECT statistic from original data X1, X2, X3….Xn Randomly and independently re-sampling with replacement from original data Do Bootstrap and get multiple values of the DETECT statistics
D0 D1 X2 X1 D2 X2 X7 X7 X5 X5 X6 X2 X1 X8 X3 X7 X4 X5 X6 Dr X1, X2, X3, X4, X5, X6, X7, X8 X1 X1 X2 X3 X6 X5 X1 X2
Roussos’s BS Efron’s BS Bootstrap methods Calculate SE of the bootstrap
Split into TS and CVS. Get Cluster from TS Get statistics from CVS DETECT using Bootstrap Do bootstrap re-sample D1 D2 Dr . . .
Method • 400 trials for simulation study to get true DETECT estimators • Two Bootstrap re-sample methods (Efron method & Roussos method)
UNI vs. Two • Only use simple structure • 20 vs. 40 • 10/10 • 15/25 & 20/20 • 1000 vs. 4000 0.5 vs. 0.7 100 vs. 400 Method • No. of dimension : • Correlation between dimensions: • Test length : • No. of examinees: • No of bootstrap
No. Examinees Test length No. Replication 100 1000 400 20 100 4000 400 100 1000 400 40 100 4000 400 Method 1D
No. Items 100 0.5 100 100 400 1000 0.7 400 400 20 0.5 100 100 4000 0.7 400 400 100 15/25 400 0.5 100 20/20 1000 400 0.7 40 0.5 4000 0.7 Method 2D
Results • DETECT Estimator • The Rule of Thumb • 0<D<0.2: unidim’nal to weak multidim’nal • 0.2<D<0.4: weak to moderate multidimensionality • 0.4<D<1.0: moderate to strong multidimensionality • 1.0<D: very strong multidimensionality
Conclusion & Discussion • Both Bootstrap methods worked well • SE from both methods were pretty close to SD of 400 trial simulation study. • Some suggestions • sample size could be a cause of bias (especially unidimensional test structure) • In order to have appropriate DETECT estimator, we should have enough (>1000) sample size.
Conclusion & Discussion • For future study • Condition on the same cluster structure • More no. of bootstrap replication (ex. looking for no. of replication for convergent point, etc) • Confidence Interval
Thank you eunlim1@uiuc.edu
IDN index • The percentage of the item pairs in the cluster for which the large sample estimated within-ccov’s were positive and the estimated between-ccov’s were negative. Ratio r R(P) =