Download
1 / 17
170 likes | 377 Views
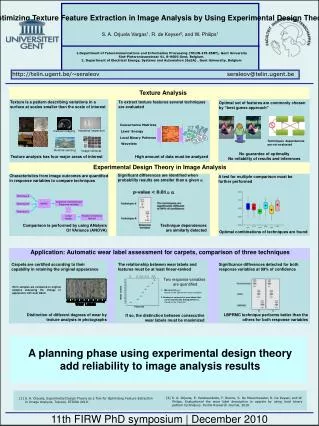
Description of the enzymatic browning in avocado slice using GLCM image texture Stefany Cárdenas , Roberto Quevedo*, Emir Valencia and José Miguel Bastías Departamento de Acuicultura & Recursos Agroalimentarios Universidad de Los Lagos, Osorno, Chile

E N D
Description of the enzymatic browning in avocado slice using GLCM image texture Stefany Cárdenas , Roberto Quevedo*, Emir Valencia and José Miguel Bastías Departamento de Acuicultura & Recursos Agroalimentarios Universidad de Los Lagos, Osorno, Chile Departamento de Ingeniería en Alimentos, Universidad del BioBio, Chillán, Chile. Departamento de Ingeniería Bioquímica Escuela Nacional de Ciencias Biológicas del Instituto Politécnico Nacional, México D. F. *rquevedo@ulagos.cl
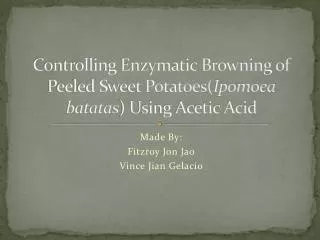
Introduction Browning of raw fruits is a major problem in the food industry and is believed to be one of the main causes of quality loss during post-harvest handling and processing. Whenthefruitsare cut, the cut surface turns brown; it reduces not only the visual quality but also results in undesirable changes in flavour and nutrient loss due to enzymatic browning. Traditionally, enzymatic browning has been quantified using browning indicators trough of biochemical index, for example thepolyphenol oxidase activityor physical indicators, such as the color surface.
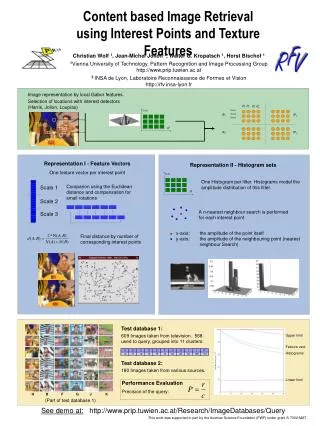
In the case of physical indicators based on color, CIELab color space has been the most extensively used color model; especially the L value (lightness), which has been used as a browning indicator in fruits. However, in fruit slices, the development of non-uniform color patterns during browning isobserved, specifically L parameter. Image texture has been suggested in order to quantify these patterns or its heterogeneity. Apple slice Quevedo et al, (2009)
In this context, the parameters obtained from the grey level co-occurrence matrix (GLCM), such as Contrast (con), Energy (E), Homogeneity (H) and Entropy (Ent) may be the most classic image texture used in food science Also standard deviation of the data on the images, can be used in order to describe reaction kinetics heterogeneity in food samples. Entropy: 9.856 Entropy: 8.647 Heterogeneity
Objective The aim of this work is to apply the aforementioned textural methods in order to determine whether they can be used as indicators to describe reaction kinetics in food, specifically in avocado.
MATERIALS AND METHODS Avocado images corresponding to unpublished data from Quevedo et al (2011)* were used. Twelve slices with 10 mm of thickness and each placed into a 2 cm x 2 cm container were used as samples. They were placed together under the camera of a computer vision system (CVS). Pictures were taken every five minutes during 750 minutes. The experiments were replicated three times at a room temperature of 4 °C and the images (2800 x 2100 pixels) were stored in Tiff format
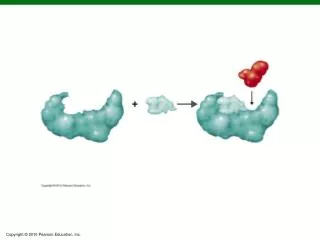
IMAGE TEXTURE ANALYSIS Color images were transformed to CIELabcolor space using the quadratic model function proposed by Leon et al. (2006). The well-known textural parameter called the Gray-Level Co-Occurrence Matrix (GLCM function) was applied to the images. They characterize the texture of an image by calculating how often pairs of pixels with specific values and in a specified spatial relationship occur in an image. * R. Quevedo et al. / Journal of Food Engineering 105 (2011) 210–215
The GLCM function from Matlab® R2010a (The MathWorks company) was used to compute these textural features: Contrast (con) measures the local variations in the grey level co-occurrence matrix. Homogeneity or Inverse difference moment was calculated according to: Energy, is the sum of squared elements in the GLCM: Additionally, the classic image texture analysis based on the standard deviation (SD) of the data on the images (sdtfilt function in Matlab® R2010a) was applied
KineticModel of browning In order to express a kinetic rate of browning, the extensional power law model was applied to the data Where Ct is the average of the L* values on the image; or the image texture value at time t; C0 is the initial value, K is a rate parameter, and n is a parameter called “shape factor”. The shape factor is a measure of the degree of concavity and the direction of the fitted curves.
Results and discussions Fig. 1. Image of the one sample (avocado surface) during the kinetic at 4 °C
Fig. 2. Change in the mean L* value during the kinetic; corresponding to sample in Figure 1.
Fig. 3. Change in the image texture (con) value during the kinetic; corresponding to sample in Figure 1.
Fig. 4. Change in the image texture (E) value during the kinetic; corresponding to sample in Figure 1
Fig. 5. Change in the image texture (H) value during the kinetic; corresponding to sample in Figure 1
Fig. 6. Change in the image texture (SD) value during the kinetic; corresponding to sample in Figure 1.
Conclusions It is possible to use GLCM image textures to model browning kinetic; because intensity surface (in one image) becomes more jagged and that the local variation in color intensity changes non-homogeneously during the browning. Considering that the enzymatic browning is heterogeneous in essence, GLCM image textures can describe the reaction without using the average color data on images. The rate derived from the mean L* intensity color was similar to that derived from the energy texture; but in general, excepted the energy texture index, rates generated using the image textures give different values from those obtained using the classical browning index. ThankYou !