Download
1 / 1
20 likes | 114 Views
Inert polyimide. µ-filter. Enrichment column. Analytical column. Sprayer-tip. A Novel Two-Dimensional LC/MS/MS Approach For Automated Analysis Of Complex Protein Samples Using Ms Compatible Buffers Paul Shieh 1 , May Xu 1 , Christine Miller 2 and Ken Miller 2

E N D
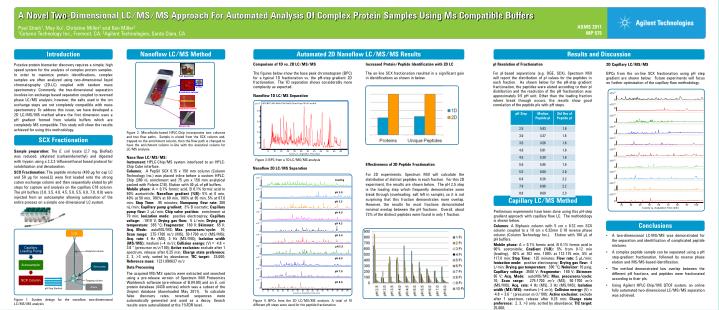
Inert polyimide µ-filter Enrichment column Analytical column Sprayer-tip A Novel Two-Dimensional LC/MS/MS Approach For Automated Analysis Of Complex Protein Samples Using Ms Compatible Buffers Paul Shieh1, May Xu1, Christine Miller2 and Ken Miller2 1Column Technology Inc., Fremont, CA; 2Agilent Technologies, Santa Clara, CA ASMS 2011MP 575 Results and Discussion Introduction Nanoflow LC/MS Method Automated 2D Nanoflow LC/MS/MS Results Results and Discussion Results and Discussion Putative protein biomarker discovery requires a simple, high speed system for the analysis of complex protein samples. In order to maximize protein identifications, complex samples are often analyzed using two-dimensional liquid chromatography (2D-LC) coupled with tandem mass spectrometry. Commonly, the two-dimensional separation involves ion exchange based separation coupled to reversed phase LC/MS analysis; however, the salts used in the ion exchange steps are not completely compatible with mass spectrometry. To address this issue, we have developed a 2D LC/MS/MS method where the first dimension uses a pH gradient formed from volatile buffers which are completely MS compatible. This study will show the results achieved for using this methodology. Comparison of 1D vs. 2D LC/MS/MS The figures below show the base peak chromatogram (BPC) for a typical 1D fractionation vs. the pH-step gradient 2D fractionation. The 1D separation shows considerably more complexity as expected. Increased Protein/Peptide Identification with 2D LC The on-line SCX fractionation resulted in a significant gain in identifications as shown in below. pI Resolution of Fractionation For pI-based separations (e.g. OGE, SCX), Spectrum Mill will report the distribution of pI values for the peptides in each fraction. As shown below for the pH-step gradient fractionation, the peptides were eluted according to their pI distribution and the resolution of the pH fractionation was approximately 0.5 pH unit. Other than the loading fraction where break through occurs, the results show good correlation of the peptide pIs with pH steps. 2D Capillary LC/MS/MS BPCs from the on-line SCX fractionation using pH step gradient are shown below. Future experiments will focus on further optimization of the capillary flow methodology. Nanoflow 1D LC/MS Separation Figure 2. Microfluidic-based HPLC-Chip incorporates two columns and two flow paths. Sample is eluted from the SCX column and, trapped on the enrichment column, then the flow path is changed to have the enrichment column in-line with the analytical column for LC/MS analysis. SCX Fractionation Sample preparation: The E. coli lysate (2.7 mg, BioRad) was reduced, alkylated (carbamidomethyl) and digested with trypsin using a 2,2,2-trifluoroethanol based protocol for solubilization and denaturation. SCX Fractionation: The peptide mixtures (400 µg for cap LC and 50 µg for nanoLC) were first loaded onto the strong cation exchange column and then sequentially eluted by pH steps for capture and analysis on the capillary C18 column. The pH buffers (3.0, 3.5, 4.0, 4.5, 5.0, 5.5, 6.0, 7.0, 8.0) were injected from an autosampler allowing automation of the entire process on a simple one-dimensional LC system. Nano flow LC/MS/MS: Instrument: HPLC-Chip/MS system interfaced to an HPLC-Chip Cube interface. Columns: A PepSil SCX 0.15 x 150 mm column (Column Technology Inc.) was placed inline before a custom HPLC-Chip (380 nL enrichment and 75 µm x 150 mm analytical packed with Polaris C18). Elution with 40 µL of pH buffers. Mobile phase: A = 0.1% formic acid, B 0.1% formic acid in 90% acetonitrile; Nanoflow gradient (%B): 5% at 0 min, 40% at 50 min, 100% at 60 min, 100% at 65 min, 5% at 67.0 min; Stop Time: 95 minutes; Nanopump flow rate: 300 nL/min; Capillary pump gradient: 3% B isocratic; Capillary pump flow: 2µL/min; Chip valve position: enrichment at 70 min; Ionization mode: positive electrospray; Capillary voltage: -1910 V; Drying gas flow: 5 L/min; Drying gas temperature: 365 °C; Fragmentor: 180 V; Skimmer: 65 V; Acq. Mode: autoMS/MS; Max. precursors/cycle: 10; Scan range: 275-1700 m/z (MS), 50-1700 m/z (MS/MS); Acq. rate: 4 Hz (MS), 3 Hz (MS/MS); Isolation width (MS/MS): medium (~4 m/z); Collision energy: (V) = -4.8 + 3.6 * (precursor m/z/100); Active exclusion: exclude after 1 spectrum, release after 0.25 min; Charge state preference: 2, 3, >3 only, sorted by abundance; TIC target: 25,000; Reference mass: 1221.990637 m/z Data Processing The acquired MS/MS spectra were extracted and searched using a pre-release version of Spectrum Mill Proteomics Workbench software (pre-release of B.04.00) and an E. coli protein database (4430 entries) which was a subset of the Uniprot database (downloaded May 2011). To calculate false discovery rates, reversed sequences were automatically generated and used as a decoy. Search results were autovalidated at the 1%FDR level. Figure 3: BPC from a 1D LC/MS/MS analysis Effectiveness of 2D Peptide Fractionation For 2D experiments, Spectrum Mill will calculate the distribution of distinct peptides in each fraction. For this 2D experiment, the results are shown below. The pH 2.5 step is the loading step which frequently demonstrates some break through (overloading, salt left in sample), so it is not surprising that this fraction demonstrates more overlap. However, the results for most fractions demonstrated minimal overlap between the pH fractions. Overall, about 72% of the distinct peptides were found in only 1 fraction. Nanoflow 2D LC/MS Separation Loading pH 3.0 Capillary LC/MS Method pH 3.5 Preliminary experiments have been done using this pH-step gradient approach with capillary flow LC. The methodology is shown below. Columns: A Biphasic column with 5 cm x 0.32 mm SCX column coupled to a 10 cm x 0.32mm C-18 reverse phase column (Column Technology Inc.). Elution with 100 µL of pH buffers. Mobile phase: A = 0.1% formic acid, B 0.1% formic acid in 90% acetonitrile; Gradient (%B): 5% from 0-12 min (loading), 40% at 102 min, 100% at 112-115 min, 5% at 117.0 min; Stop Time: 125 minutes; Flow rate: 5 µL/min; Ionization mode: positive electrospray; Drying gas flow: 4 L/min; Drying gas temperature: 300 °C; Nebulizer: 10 psig; Capillary voltage: -3500 V; Fragmentor: 180 V; Skimmer: 65 V; Acq. Mode: autoMS/MS; Max. precursors/cycle: 10; Scan range: 275-1700 m/z (MS), 50-1700 m/z (MS/MS); Acq. rate: 4 Hz (MS), 3 Hz (MS/MS); Isolation width (MS/MS): medium (~4 m/z); Collision energy: (V) = -4.8 + 3.6 * (precursor m/z/100); Active exclusion: exclude after 1 spectrum, release after 0.25 min; Charge state preference: 2, 3, >3 only, sorted by abundance; TIC target: 25,000; pH 4.0 Conclusions pH 4.5 Q-TOF • A two-dimensional LC-MS/MS was demonstrated for the separation and identification of complicated peptide mixtures. • A complex peptide sample can be separated using a pH step-gradient fractionation, followed by reverse phase elution and MS/MS-based identification. • The method demonstrated low overlap between the different pH fractions, and peptides were fractionated according to their pIs. • Using Agilent HPLC-Chip/MS QTOF system, an online fully automated two-dimensional LC/MS/MS separation was achieved. pH 5.0 Analytical column pH 5.5 Nano pump pH 6.0 pH 7.0 Trapping column Waste pH Step Gradient pH 8.0 Figure 1. System design for the nanoflow two-dimensional LC/MS/MS analysis Figure 4: BPCs from the 2D LC/MS/MS analysis. A total of 10 different pH steps were used for the peptide fractionation.