Download
1 / 41
420 likes | 612 Views
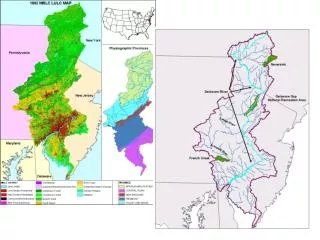
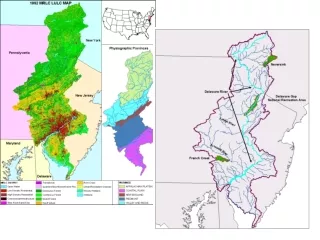
Effects of Rising Nitrogen Deposition on Forest Carbon Sequestration and N losses in the Delaware River Basin Yude Pan, John Hom, Richard Birdsey, Kevin McCullough USDA Forest Service, Newtown Square, PA 19073, USA. Delaware River Basin

E N D
Effects of Rising Nitrogen Deposition on Forest Carbon Sequestration and N losses in the Delaware River Basin Yude Pan, John Hom, Richard Birdsey, Kevin McCullough USDA Forest Service, Newtown Square, PA 19073, USA
Delaware River Basin Collaborative Environmental Monitoring and Research Initiative (CEMRI) A Pilot Program of the National Environmental Monitoring Initiative (NEMI) USDA Forest Service USGS National Park Service
Scientific issues How does the increased atmospheric N deposition interact with other stressors to affect forest carbon sequestration in the Delaware River Basin? What is the potential capacity of the forests retaining the atmospheric N deposition and how much of nitrate is lost annually from forests to surface water in the Delaware River Basin?
Diagram of PnET Model 1. Gross photosynthesis 2. Foliar respiration 3. Transfer to mobile C 4. Growth and maintain resp. 5. Allocation to buds 6. Allocation to fine roots 7. Allocation to wood 8. Foliar production 9. Wood production 10. Soil production 11. Precipitation 12. Interception 13. Snow-rain partition 14. Snowmelt 15. Fast flow 16. Water uptake 17. Transpiration 18. Drainage 19. Wood litter 20 Root litter 21. Foliar litter 22. Wood decay 23. Mineralization 24. N uptake 25. To soil solution Water Carbon/Nitrogen 2 1 17 11 12 Foliar Canopy 4 3 13 7 Wood C/N Plant C/N 8 5 Snow 16 9 14 Bud C/N 6 Wood 24 Fine Root 19 10 Soil Water Dead Wood NH4 NO3 15 20 25 22 23 21 18 Soil
Model concepts • Process-based, mechanistic models. • Simulate carbon, nitrogen and water cycles, pools and fluxes based on mass-balance. • We can more successfully predict the variables in terrestrial ecosystems if we model the basic processes controlling them. • Methodology differs from classic statistical based empirical relationships. • Feedbacks and constraints on fluxes and pools affect the ecosystem as a whole.
Diagram of PnET Model 1. Gross photosynthesis 2. Foliar respiration 3. Transfer to mobile C 4. Growth and maintain resp. 5. Allocation to buds 6. Allocation to fine roots 7. Allocation to wood 8. Foliar production 9. Wood production 10. Soil production 11. Precipitation 12. Interception 13. Snow-rain partition 14. Snowmelt 15. Fast flow 16. Water uptake 17. Transpiration 18. Drainage 19. Wood litter 20 Root litter 21. Foliar litter 22. Wood decay 23. Mineralization 24. N uptake 25. To soil solution Water Carbon/Nitrogen 2 1 17 11 12 Foliar Canopy 4 3 13 7 Wood C/N Plant C/N 8 5 Snow 16 9 14 Bud C/N 6 Wood 24 Fine Root 19 10 Soil Water Dead Wood NH4 NO3 15 20 25 22 23 21 18 Soil
Scenarios of Atmospheric Chemistry N deposition (Kg/ha) Elevated CO2 (ppmv) Year Year
Annual NPP (g/m2) Annual NPP under Different Scenarios (Delaware River Basin ) +22% +12% +47% +25%
Forest Biomass under Different Scenarios Biomass (Mg /ha) +11% +18% +38% +4%
Soil Organic Matter under Different Scenarios Soil organic matter (Mg/ha) +22% +5% +28% +34%
Selected FIA sites (mature) for validation (n=98)
Conclusions: The modeling results suggest that chronic N increases in the past 70 years has increased forest productivity by 22%, forest biomass of 11% and soil organic matter of 22%. Overall, the interactive effects of rising N deposition and CO2 caused remarkable C gains in forest living biomass (38%) and soil mass (28%). The forest regrowth in the region only counted for about 62% of the carbon sequestrated in the forest ecosystems. Forests in the Basin seem close to N saturation status under current N deposition level. 2X N deposition resulted in similar increases in annual NPP, and lower forest biomass with respect to 1X N.
The current N leaching loss from the forested land of the DRB is 1.7 Kg/ha, and N retention rate is 85%. With 2X N deposition scenario, the N retention rate will drop to 75% and the total N export to stream water would nonlinearly increase by 330%. Extending the current 1X N regulation for another 50 years, leveling off N deposition at the current level would lower retention to 79% from 85%, and the total N export would increase by 38%, suggesting there will eventually be N saturation at current deposition levels.
Future Work: Explore the effects of zone and calcium depletion on forest productivity. Improve the modeling predictions at the basin level by incorporating information of forest fragmentation and land-use types. Refine the modeling work with the MODIS vegetation classes and the new parameterization. Explore the effects of climatic variations and interactions with other global change factors. Project the forest conditions under the 2100 scenario with multiple stressors.