Download
1 / 30
300 likes | 438 Views
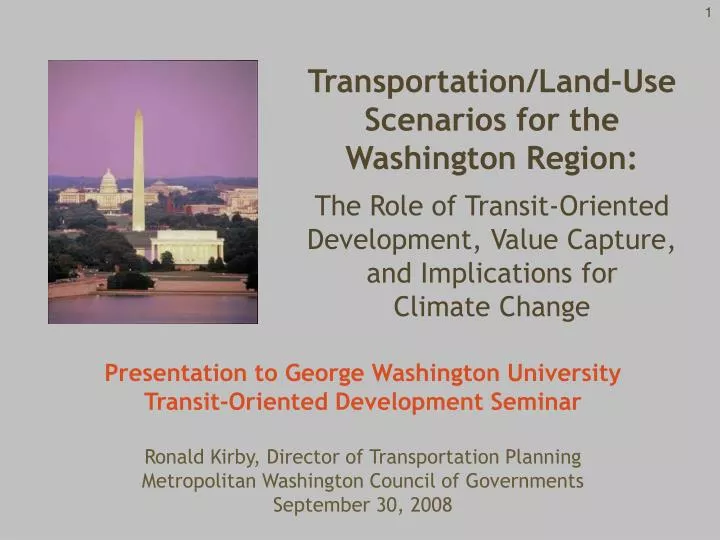
Transportation/Land-Use Scenarios for the Washington Region: The Role of Transit-Oriented Development, Value Capture, and Implications for Climate Change. Presentation to George Washington University Transit-Oriented Development Seminar Ronald Kirby, Director of Transportation Planning

E N D
Transportation/Land-Use Scenarios for the Washington Region:The Role of Transit-Oriented Development, Value Capture, and Implications for Climate Change Presentation to George Washington University Transit-Oriented Development Seminar Ronald Kirby, Director of Transportation Planning Metropolitan Washington Council of Governments September 30, 2008
Transportation Planning in the Washington Region • Approximately 3,000 square miles • Includes 5 million people and 3 million jobs • The National Capital Region Transportation Planning Board (TPB) prepares a financially constrained, 30-year transportation plan for the TPB planning area
Where is the growth occurring in the region? Estimates based on Round 7.1 of the Cooperative Land Use Forecast
Greatest Congestion in Inner Suburbs The Most Dramatic Change is in Outer Suburbs Urban core defined as The District, Arlington and Alexandria. Inner suburbs defined as Fairfax county in Virginia and Montgomery and Prince George’s counties. Outer Suburbs defined as Loudoun, Prince William, and Stafford counties in Virginia; Frederick, Calvert and Charles counties in Maryland.
Shifting Funding Sources Total CLRP Revenues 2007 – 2030: $4.5 Billion per year (2006 dollars)
Most Transportation Dollars Are Needed for Maintenance New Roads and Transit* 30% 70% Operations & Preservation* * Based on region’s 2007 Constrained Long-Range Plan
Land Use and Population Issues • The region is growing at a rapid pace • People are living farther from their jobs • People on the eastern side of the region are commuting long distances to jobs in the west due to uneven development patterns • The land around transit stations is not being used as efficiently as we would like
5 Scenarios to address the issues: TPB Regional Mobility and Accessibility Study, 2001-2006 • 1. More Households Scenario • 2. Households In Scenario • 3. Jobs Out Scenario • 4. Region Undivided Scenario • 5. Transit-Oriented Development (TOD) Scenario
Impacts of the Scenarios: Congestion would decrease Compared to baseline forecasts for 2030
Successful Strategies From the Five Scenarios • Put jobs and households closer together • Encourage mixed-use development around transit • Provide more transit to support regional activity centers.
Outreach Program Throughout Region • Yellow Stars: Interactive Program • Orange Stars: Study Briefing 2004-2006
Recommendations from Outreach Program • Need to ensure adequate transit capacity to support TOD • Assist local jurisdictions to “do density right” • Look at composite scenarios and localized impacts • Consider broader quality of life factors • Explore ways to prioritize transportation projects on a regional level
The TPB Transportation/Land Use Connections (TLC) Program Initiated January 2007 TLC provides: Information Sharing:Comprehensive website on transportation/land use techniques and experience Technical Assistance:Consultants provide up to $20k in assistance to local jurisdictions. Continuity:Program approved for next year with max assistance increased to $60k To date:22 projects initiated in 16 jurisdictions; 6 completed
TPB Value Pricing Study October 2006-February 2008 3 Scenarios of Variably Priced Lanes (VPLs) looking at: All Freeways Arterials outside Beltway Convert existing HOV lanes Direct access ramps at key interchanges Add high quality bus transit to VPLs
Comprehensive Cost-Benefit Analysis • Practices and procedures firmly in place for virtually all types of public infrastructure • Transit the exception; assessment confined to ridership and related performance measures (transit user time savings) • Ridership reflects mobility, but not other objectives and benefits of transit: • Congestion management • Environment • Safety • Economic development • Transit-oriented development Dr. David Lewis, HDR|Decision Economics
Why is Transit Treated Differently? • Stems from FTA “New Starts Process” • FTA process designed to rate applicant projects for pool of federal funds • FTA process not designed to guide local infrastructure investment choices and trade-offs • FTA process not designed to enable comparisons of value among infrastructure alternatives (highway options; congestion pricing options; technology options) Dr. David Lewis, HDR|Decision Economics
Need Comprehensive Recognition of Transit Benefits • Mobility • Congestion Management • Community Economic Development Dr. David Lewis, HDR|Decision Economics
Mobility • Time savings to transit users • Cash savings to low income households for reallocation to housing, nutrition, child care … • Cross-sector benefits: reduced financial burden on social services Dr. David Lewis, HDR|Decision Economics
Congestion Management • Reduced delay • Improved reliability, predictability and productivity • Reduced environmental emissions • Lower vehicle operating costs • Safety (lives, injuries, property) Dr. David Lewis, HDR|Decision Economics
Community Economic Development Location Efficiency Measurement • High density economic activity • Less demand for motorized trips • Reduced auto-ownership requirements, dependence • Higher density life-style • Development benefits measured as increased economic growth • land value Dr. David Lewis, HDR|Decision Economics
CASE: Streetcar Investment(Cincinnati, Ohio) Focus on ridership benefits alone can miss financing opportunities and lead to the mistaken conclusion that a project is not economically worthwhile Dr. David Lewis, HDR|Decision Economics
Value of Cost-Benefit Analysis • Enables quantitative understanding of significance of transit investment for economic well-being of region • Facilitates understanding of development-based financing capacity of transit investment • Facilitates community understanding, deliberation and consensus • Allows comparative ranking of alternative scenarios for the region, including transit, highways, pricing and other policy options Dr. David Lewis, HDR|Decision Economics
Two New Scenarios CLRP Aspirations What Would it Take? Draws on past scenarios (5 transportation/land use scenarios and 3 value pricing scenarios) to provide an ambitious yet attainable vision of land use and transportation for the 2010 CLRP update. Starts with CO2 goals (80% below 2005 levels in 2050 and 20% reduction by 2020) and assesses what scales and combinations of interventions will be necessary to achieve the goal.
Land Use Changes Based on Previous Scenarios: New Scenario Growth Shifts from 2010-2030 Employment Households
Proposed BRT Network on Variably Priced Lanes Bus stations are located in activity centers, park and ride lots and existing Metrorail stations via dedicated access ramps
Addressing New Issues: Climate Change Changes in Travel Demand, Mobile Emissions and Demographics (for the 8-Hour Ozone Non-Attainment Area)
Responding to Climate Change Goal:To reduce CO2 emissions by 10%, 20% and 80% below 2005 levels in 2012, 2020 and 2050 respectively
Reducing Mobile GHG Emissions 3 categories of strategies to reduce mobile CO2 emissions Fuel Efficiency Fuel Carbon Intensity Travel Efficiency Reduce VMT through changes in land use, travel behavior, prices Reduce congestion Improve operational efficiency Beyond CAFE standards [currently 35 mpg by 2020] Alternative fuels (biofuels, hydrogen, electricity) Vehicle technology (hybrid engine technology)
Key Strategies for the Future • Keep making the case for increased federal and state funding • Consider a wide variety of other funding sources, including tolls and local proffers, impact fees and bonding • In the short-run, address localized choke-points; manage demand; and improve operations and incident management • In the longer-run, do a better job of integrating land use and transportation