Download
1 / 2

E N D
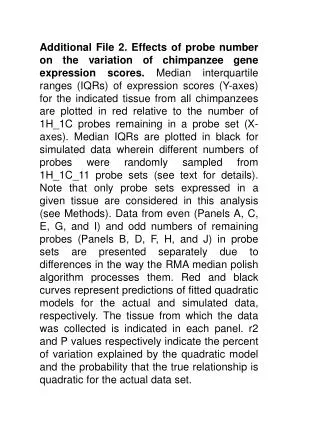
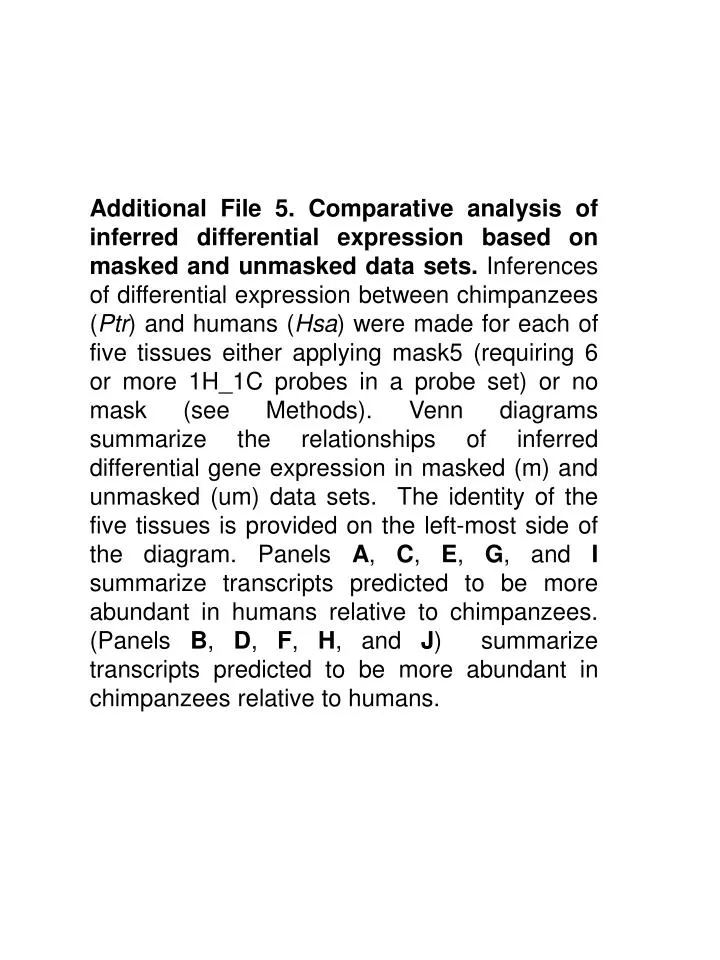
Additional File 5. Comparative analysis of inferred differential expression based on masked and unmasked data sets. Inferences of differential expression between chimpanzees (Ptr) and humans (Hsa) were made for each of five tissues either applying mask5 (requiring 6 or more 1H_1C probes in a probe set) or no mask (see Methods). Venn diagrams summarize the relationships of inferred differential gene expression in masked (m) and unmasked (um) data sets. The identity of the five tissues is provided on the left-most side of the diagram. Panels A, C, E, G, and I summarize transcripts predicted to be more abundant in humans relative to chimpanzees. (Panels B, D, F, H, and J) summarize transcripts predicted to be more abundant in chimpanzees relative to humans.
A B 249 1113 1245 112 229 303 brain m um m um C D 476 2366 1647 303 549 398 heart m um m um E F 355 1119 1035 380 1361 602 kidney m um m um G H liver 271 1427 1109 336 1017 489 m um m um I J 633 3519 1998 509 2239 931 testes m um m um higher in Hsa than Ptr higher in Ptr than Hsa