Download
1 / 43
430 likes | 585 Views
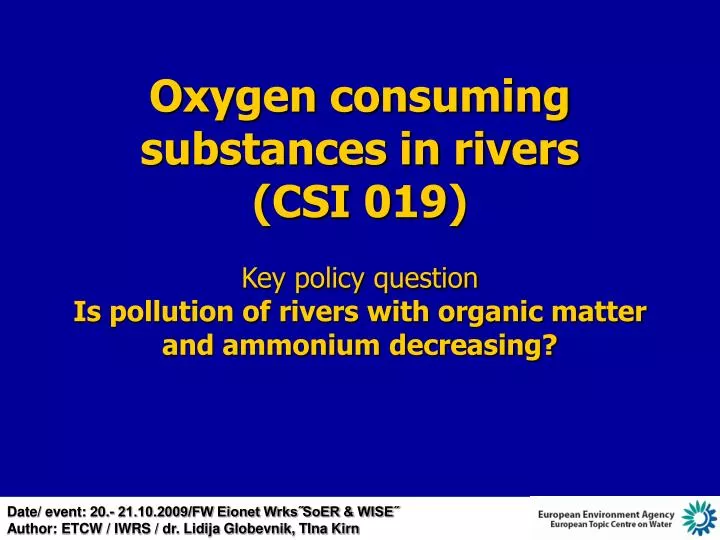
Oxygen consuming substances in rivers (CSI 0 19 ) Key policy question Is pollution of rivers with organic matter and ammonium decreasing?. Data source. Waterbase - Rivers (WISE SoE). Quality + Station table

E N D
Oxygen consuming substances in rivers(CSI 019)Key policy questionIs pollution of rivers with organic matter and ammonium decreasing?
Waterbase - Rivers (WISE SoE) Quality + Station table • based on annual reports “River quality (EWN-1)” by EEA Member and Collaborating countries (Reportnet – CDR) • compiled and quality checked by ETCW (clarifications by country reporters) • further quality checked by EEA • available at EEA Data service website (latest version: v9)
Quality checked WISE SoE data • Logical rules (relations: mean, min, max …) • Outliers • Chemical rules: -BOD5 < COD, -BOD5 < TotalOrganicCarbon, -Kjeldahl Nitrogen = Organic Nitrogen + Total Ammonium (+-5% toleration if all values available), -Total Oxidised Nitrogen = Nitrate + Nitrite (+-5% toleration if all values available)
Parameters Data selection • Biological Oxygen Demand (BOD5, BOD7mg O2/l) • total ammonium (NH4µg N/l) BOD7is converted into BOD5 (BOD7 = 1.16 x BOD5) • annual mean values: • non-flagged values (logical rules, outliers, chemical rules) except for zero values (“0”): below LOD • BOD5 <100 mg O2/l
Data preparation and aggregation: Method for data preparation: • Europe: time series of minimum seven years in the period of 1992-2007 (no inter- or extrapolation of data gaps) • Countries, countries grouped into regions: consistent time series after inter or extrapolation of 1 or 2-year data gap at all stations Method for aggregation of data: • weighted average on the number of stations by countries • RBD level: data for the latest year if ≤ 10 stations per RBD: median if > 10 stations per RBD: ”avg95” (average of values below 95% quantile)
Countries: Time series plots: • By countries • Included into regions (Fig.2 and 3) Time trends: • Mann-Kendall trend analysis is used for each time series. • Results are categorized into 5 classes: - Very negative trend - Marginally negative trend - No significant trend - Marginally positive trend - Very positive trend More details in CSI 020 presentation
Countries: • Latest Year Concentrations: categorized into 5 quality classes for the latest year with available data: • Also displayed as WISE interactive maps (WISE Map Viewer): - country level: pie-charts (BOD5 and total ammonium) - national RBD level: coloured (BOD5)
Northern Europe Western Europe Eastern Europe Southern Europe Southeastern Europe Map of geographic regions
Map of RBDs • national and international RBDs • countries with national RBDs (EU-27 MS + NO and CH)
Map of RBD’s “Sea Regions” (aggregation of RBDs to 5 sea basins) used for EU official report of bathing water quality in 2007 and 2008. Source: EU report on bathing water quality
Fig. 1: BOD5 and total ammonium concentrations in rivers between 1992 and 2007 BOD5: - 47 % (23 countries) Total ammonium: - 59 % (25 countries) BOD5: AT (111), BA (1), BE (40), BG (92), CZ (72), DK (39), ES (333), FR (373), IE (45), IT (56), LU (3), MK (2), NL (2), PL (122), RO (91), SI (14), SK (55), UK (29) / BOD7: EE (53), FI (48) / BOD5, BOD7: LT (64), LV (56), HU (93). Total ammonium: AL (18), AT (148), BE (40), BG (109), DE (148), DK (37), EE (53), ES (487), FI (180), FR (345), HU (35), IE (32), IS (1), IT (35), LT (64), LU (3), LV (63), MK (19), NL (4), NO (10), PL (130), RO (108), SE (114), SI (24), UK (176)
Fig. 2: BOD5 concentrations in rivers between 1992 and 2007 in Geographical Regions: 1992-2007: -WE rivers: -50 % (increase from 2006) -NE rivers: -22 % (decrease from 2005) -EE rivers: -32 % 2000-2007:SE rivers: -35 % (increase from 2003) 2001-2007: SEE rivers: -4 % (increase from 2004) Northern Europe: FI (12). Western Europe: AT (7), BE (2), DK (12), FR (90), LU (3), UK (25). Eastern Europe: CZ (49), EE (45), HU (11), LT (24), LV (39), SI (1), SK (1). Southern Europe: ES (195), IT (18). Southeastern Europe: BA (1), BG (47), HR (22), RO (91).
Fig. 2a: BOD5 concentrations in rivers between 2001 and 2007 in European countries Countries by: -increase vs. decrease in conc. -lowest vs. highest conc. -stable conc. vs. fluctuations
Fig. 2b: BOD5 concentrations in rivers between 1992 and 2007 by Sea Regions of Europe 1992-2007: -Atlantic Ocean: -46 % -North Sea: -31 % -Baltic Sea: -19 % 2000-2007: -Mediterranean Sea: -55 % (increase from 2004): lowest conc. 2001-2007: -Black Sea: -7 % (increase from 2004): highest conc.
Fig. 3: Total ammonium concentrations in rivers between 1992 and 2007 in geographic regions of Europe 1992-2007: -WE rivers: -75 % -EE rivers: -75 % -NE rivers: -11 % (low conc.) 2000-2007: -SE rivers: -56 % (fluctuating conc. with peaks in 2002 and 2005) 2001-2007: - SEE rivers: - 32 % (increaseabove SE rivers conc. in 2007) Northern Europe: FI (39), NO (10), SE (104). Western Europe: AT (34), BE (8), DE (99), FR (25), LU (3), UK (3). Eastern Europe: EE (41), HU (3), LT (24), LV (32), PL (71), SI (13). Southern Europe: ES (245), IT (2). Southeastern Europe: AL (17), BA (8), BG (105), HR (28), MK (18), RO (108), RS (24).
Fig. 3b: Total ammonium concentrations in rivers between 1992 and 2007 in Sea Regions of Europe 1992-2007: -Atlantic Ocean: -78 % (highest and very fluctuating conc.) -North Sea: -71 %, Baltic Sea: -73 % -Norwegian Sea and Barents Sea: low conc. (2 and 1 station only) 2000-2007: -Mediterranean Sea: -23 % (increase from 2004 above conc. in Baltic Sea) 2001-2007: -Black Sea: -33 % (increase from 2006)
Fig. 4: Percentage of river stations per country with significant increasing, stable or decreasing BOD trend between 1992 and 2007 and between 2000 and 2007 >60 % of stations with decreasing trend Decreasing trend: 57.8 % Europe Between 1992 and 2007 Increasing trend: 3.4 % Between 2000 and 2007 A half of countries (7) without stations with increasing trend. >7 % of stations with increasing trend: Finland (7.1 %), Denmark (11.4 %), Lithuania (12.0 %), Estonia (15.7 %) Decreasing trend: 22.1 % Europe Increasing trend: 6.2 %
Fig. 4: Percentage of river stations per country with significant increasing, stable or decreasing BOD trend between 1992 and 2007 and between 2000 and 2007 Short time series: more countries, more stations/country, but less stations with decreasing trend!
Fig. 5: Percentage of river stations per country with significant increasing, stable or decreasing total ammonium trend between 1992 and 2007 and between 2000 and 2007 Between 1992 and 2007 >60 % of stations with decreasing trend Decreasing trend: 54.9 % Europe Between 2000 and 2007 Increasing trend: 5.7 % Decreasing trend: 19.9 % Europe A half of countries (8) without stations with increasing trend. >4 % of stations with increasing trend: Spain (4.5 %), France (5.5 %), Sweden (29.2 %). Increasing trend: 6.8 %
Fig. 5: Percentage of river stations per country with significant increasing, stable or decreasing total ammonium trend between 1992 and 2007 and between 2000 and 2007 Displayed as WISE interactive maps (WISE Map Viewer) on country and national RBD level.
Fig. 6: Frequency distribution of concentration of BOD5 (mg O2/l) in rivers in European countries, 2007 or the latest year with available data >=50 % of stations in 1st class >20 % of stations in 5th class: Belgium (51; 23.5 %) Luxembourg (3; 33.3 %) Cyprus (9; 22.2 %) Italy (1234; 24.4 %) Portugal (33; 45.5 %) Bulgaria (87; 23.0 %) Romania (118; 26.3 %) Turkey (2; 50.0 %) Albania (23; 65.2 %)
Fig. 7: Frequency distribution of concentration of total ammonium (mg N/l) in rivers in European countries, 2007 or the latest year with available data >=50 % of stations in 1st class >=20 % of stations in 5th class: Greece (13; 23.1 %), Portugal (47; 25.5 %) Macedonia, FYR (19; 21.1 %) Romania (118; 24.6 %) Albania (51; 29.4 %) Bulgaria (107; 34.6 %) Ireland (5; 20.0 %) Luxembourg (4; 25.0 %) the Netherlands (12; 41.7 %) Belgium (55; 65.5 %)
Questions, problems Different data selection criteria and spatial aggregation influence the results
Problems with data • outliers: errors or actual high values (polluted) • zero values: values below LOD or no monitoring • chemical rules: why e.g. BOD5 < COD (is COD wrongly measured?) • latest vs. previous years: if much less stations are reported compared to previous years(WHY?) • long vs. short time series • non-representativeness: small number of stations per country in region time series Should be clarified by countries! change criterion to
Alternative Fig. 2: BOD5 concentrations in rivers between 1992 and 2007 in different regions of Europe: “0” excluded “0” excluded “0” included
Alternative Fig. 2: BOD5 concentrations in rivers between 1992 and 2007 in different regions of Europe: chemical rules ignored (flagged values included) values included values excluded
Northern Europe: plus Baltic countries Western Europe Central Europe: Eastern Europe plus AT, CH, DE, LI Southern Europe Southeastern Europe Map of alternative geographic regions Turkey: Southeastern Europe?
Alternative Fig. 2: BOD5 concentrations in rivers between 1992 and 2007 in different Geographical Regions of Europe Baltic countries with lower concentration compared to other Eastern European countries are grouped together with Finland (Northern Europe).
Spatial units for assessment: • Countries (used at present) • RBD’s (used at present) • Geographic Regions (used at present) (for next assessment: AT and DE into Central European group; EE, LT, LV into Northern European group) • Hydrological (sub) units (testing, developing): ECRINS & WFD GIS: hydrological system, sea, primary catchments, intercatchments, sea basins
Map of RBDs • Present national RBDs (EU-27 MS + NO and CH) • New national RBDs: HR and BA • If national not determined yet: international RBDs for CSI 019 used
Information for small spatial units and locations: • Not appropriate for graph presentation, but for interactive maps and data viewers (WISE Map Viewer, WISE Data Viewer, Eye on Earth) • Difficulties to assign spatial units to stations with missing or incorrect coordinates