Download
1 / 54
560 likes | 914 Views
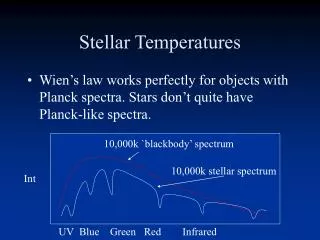
Chapter 3. Seasonal and Daily temperatures. Why the Earth has seasons. Earth revolves in elliptical path around sun every 365 days. Earth rotates counterclockwise or eastward every 24 hours. Earth closest to Sun (147 million km) in January, farthest from Sun (152 million lm) in July.

E N D
Chapter 3 Seasonal and Daily temperatures
Why the Earth has seasons • Earth revolves in elliptical path around sun every 365 days. • Earth rotates counterclockwise or eastward every 24 hours. • Earth closest to Sun (147 million km) in January, farthest from Sun (152 million lm) in July. • Distance not the only factor impacting seasons.
Why the Earth has seasons • The amount of energy that reaches the Earths surface is influence by the distance from the Sun, the solar angle, and the length of daylight. • When the Earth tilts toward the sun in summer, higher solar angles and longer days equate to high temperatures.
Why the Earth has seasons • Seasons in the Northern Hemisphere • Summer solstice: June 21, Sun directly above Tropic of Cancer, Northern Hemisphere days greater than 12 hours • Winter solstice: December 21, Sun directly above Tropic of Capricorn, Northern Hemisphere days less than 12 hours • Autumnal and Spring Equinox: September 22, Marc 20, Sun directly above Equator, all locations have a 12 hour day
Stepped Art Fig. 3-8, p. 63
Why the Earth has seasons • Special Topic: First day of winter • December 21 is the astronomical first day of winter, sun passes over the Tropic of Capricorn; not based on temperature.
Why the Earth has seasons • Seasons in the Southern Hemisphere • Opposite timing of Northern Hemisphere • Closer to sun in summer but not significant difference from north due to: • Greater amount of water absorbing heat • Shorter season
Simplified Surface Energy Balance • NET R = • + SW (insolation) • – SW (reflection) • + LW (infrared) • – LW (infrared) Figure 3.13
Local temperature variations • Southern exposure: warmer, drier locations facing south. Implications for • Vegetation • Viniculture • Ski slopes • Landscaping • Architecture
Local temperature variations • Environmental Issues: Solar Heating • In order to collect enough energy from solar power to heat a house, the roof should be perpendicular to the winter sun. • For the mid-latitudes the roof slant should be 45°- 50°
Daily temperature variations • Each day like a tiny season with a cycle of heating and cooling • Daytime heating • Air poor conductor so initial heating only effects air next to ground • As energy builds convection begins and heats higher portions of the atmosphere • After atmosphere heats from convection high temperature 3-5PM; lag in temperature
Daily temperature variations • Properties of soil affect the rate of conduction from Earth to atmosphere • Wind mixes energy into air column and can force convection.
Daily temperature variations • Nighttime cooling • As sun lowers, the lower solar angle causes insolation to be spread across a larger area • Radiational cooling as infrared energy is emitted by the Earth’s surface • Radiation inversion: air near ground much cooler than air above • Thermal belt
Stepped Art Fig. 3-14, p. 69
Daily temperature variations • Protecting crops from cold • Cover • Smudge pots • Fans • Sprinklers
The controls of temperature • Latitude: solar angle and day length • Land & water: specific heat • Ocean currents: warm and cold currents • Elevation: cooling and increase range
Land–Water Heating Differences • Evaporation • Transparency • Specific heat • Movement • Ocean currents and sea surface temperatures • Marine vs. continental effects
Land–Water Heating Differences Figure 3.20
Global Temperature Ranges Figure 3.28
Air temperature data • Daily, monthly, yearly temperature • Range: maximum minus minimum • Mean: average of temperature observations • Maximum: highest temperature of time period • Minimum: lowest temperature of time period
Air temperature data • Special topic: What’s normal? • Climate normal is the 30 year average for a given temperature variable.
Air temperature data • The use of temperature data • Heating degree-day: people heat when temperature below 65°F • Cooling degree-day: people cool when temperature above 65°F • Growing degree-day: temperature above of below base temperature for specific crop
Air temperature and human comfort • Body heats through metabolism • wind-chill index • Hypothermia • Body cools through emitting infrared energy and evaporation of perspiration
Wind Chill Table Figure 1
Heat Index Table Figure 2
Air temperature and human comfort • Observation: 1000 degrees • Thin air at the top of the atmosphere does not have enough molecules to create a high temperature as measured by a thermometer.
The Urban Environment Figure 3.29
Measuring air temperature • Thermometers: liquid-in-glass, maximum, minimum, electrical resistance, bimetallic • ASOS • Thermistors • Infrared sensors
Urban Heat Island Figure 3.30