Download
1 / 2
20 likes | 120 Views
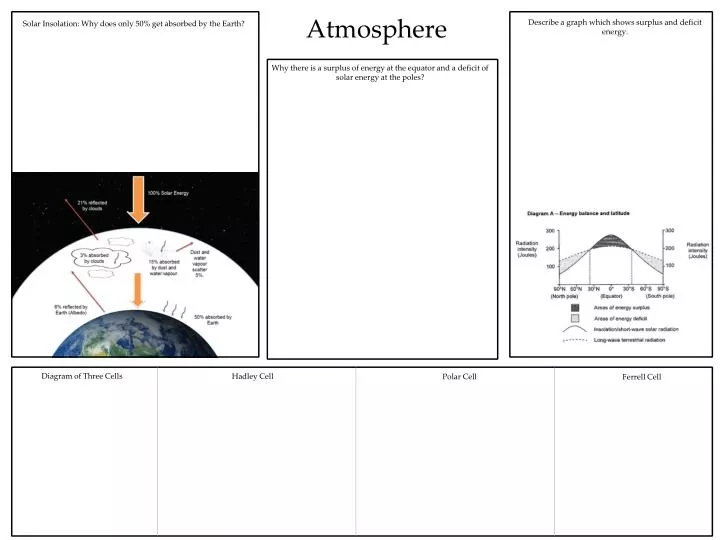
Atmosphere. Describe a graph which shows surplus and deficit energy. Solar Insolation: Why does only 50% get absorbed by the Earth?. Why there is a surplus of energy at the equator and a deficit of solar energy at the poles?. Diagram of Three C ells. Hadley Cell. Polar Cell.

E N D
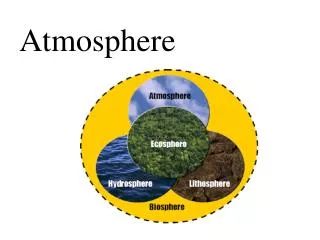
Atmosphere Describe a graph which shows surplus and deficit energy. Solar Insolation: Why does only 50% get absorbed by the Earth? Why there is a surplus of energy at the equator and a deficit of solar energy at the poles? Diagram of Three Cells Hadley Cell Polar Cell Ferrell Cell
ITCZ origin, nature and characteristics of the Tropical maritime and Tropical continental air masses. Be able to describe the pattern of Ocean Currents and explain how they help to maintain the global energy balance. Describe the changes in global temperature over time. HINT: This could be any style of graph. You must read the axis carefully! Human and Physical Causes of Climate Change Consequences of Global Warming