Download
1 / 4
40 likes | 56 Views
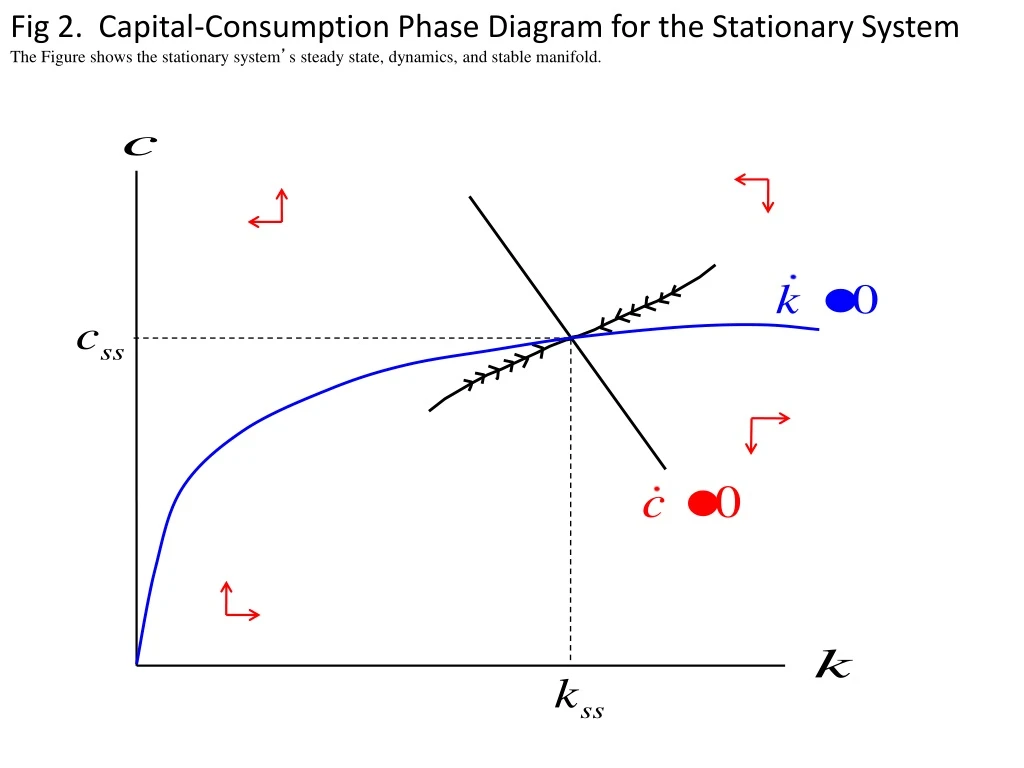
This figure illustrates the steady state, dynamics, and stable manifold of the stationary system.

E N D
Fig 2. Capital-Consumption Phase Diagram for the Stationary System The Figure shows the stationary system’s steady state, dynamics, and stable manifold.
Fig 3. Stable Manifolds for High and Low Replacement Rates The Figure shows the system’s dynamics and stable manifold. The dynamics shown by the red arrows correspond to the low replacement rate that prevailed before date 0. When the new replacement rate path is first anticipated at date 0, consumption falls, but not as far as it will fall in the long run. The new stable manifold (shown as a black path) describes dynamics once the replacement rate has reached its higher long run value.
Fig 5. Time Path for the Gradually Increasing Replacement Rate replacement rate time
Fig 7. Dynamics when the Rep. Rate Increase is Largely Temporary The Figure shows the system’s dynamics and stable manifold. The dynamics shown by the red arrows correspond to the low replacement rate that prevailed before date 0. When the new replacement rate path is first anticipated at date 0, consumption falls, but not as far as it will fall in the long run. The new stable manifold (shown as a black path) describes dynamics once the replacement rate has reached its higher long run value.