Download
1 / 13
150 likes | 979 Views
Youden Analysis. Youden Analysis. Introduction to W. J. Youden Components of the Youden Graph Calculations Getting the “Circle” What to do with the results. W. J. Youden 1900-1971. Born in Australia 1921 – B.S. in Chemical Engineering 1924 – Ph.D. Analytical Chemistry

E N D
Youden Analysis • Introduction to W. J. Youden • Components of the Youden Graph • Calculations • Getting the “Circle” • What to do with the results.
W. J. Youden 1900-1971 • Born in Australia • 1921 – B.S. in Chemical Engineering • 1924 – Ph.D. Analytical Chemistry • 1924-1948 – Plant Research • 1942-1945 – World War II • 1948 – NBS Statistical Consultant
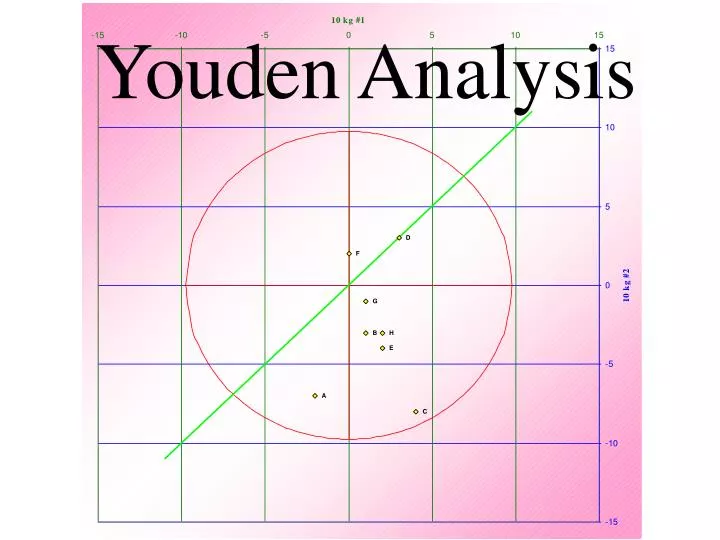
Y Axis 2sd limit of the random components X Axis Origin (0,0) Median(x,y) Known(x,y) 45 degree Components of Youden Graph
Total magnitude of Error = 7.28 Calculated by using the formula for the distance between two points (x1,y1) and (x2,y2): Intercept Point Draw a line from the Point to the 45 degree line (Perpendicular) Plot the Point (-2,-7) X-axis = -2 Y-axis = -7 Systematic and Random Components
Systematic and Random Components Systematic Distance from Origin to Intercept Calculated by using a variation of the Pythagorean formula for 45o right triangles: Origin=(x1,y1) Point = (x2,y2) Random Distance from Point to Intercept Calculated using the formula for the distance between two points:
Fitting the Ratio of Systematic & Random Errors to the Total Error Systematic Component = -6.364 (negative or positive) Random Component = 3.536 (always positive) Sum Random & Systematic = 9.900 Total Error = 7.280
Where do we get the Circle? Each Point will have a “Random Error” Random Error =2.60
(modified) Calculating the radius of the Circle Each participant’s point provides a random error (ran). Each random error is squared. These squares are then summed and divided by n-1. The square root of this result is an indication of the standard deviation based only on the random components of each point. Multiplying the standard deviation by 2.45 gives the value for the radius of the circle. (95% of the points should fall within this circle if all systematic errors could be eliminated.)
Getting the Circle on the Graph • Formula of a Circle • Formula rewritten in terms of y
Rules of Youden Analysis • Requires Two Artifacts • Must have two values to plot a point • Artifacts must be same Nominal Value • “Cannot compare Apples & Oranges” • Same procedure must be used to test both Artifacts • SOP - Restraint - Equipment - Metrologist • Artifacts should not be Tested at Same Time • Random errors appear to become more systematic when tested at the same time • Participants should be working at the same precision level • Don’t Over-Analyze • A point that lies outside the circle doesn’t necessarily mean that there is a problem (although it is never a good thing)