Download
1 / 24
240 likes | 445 Views
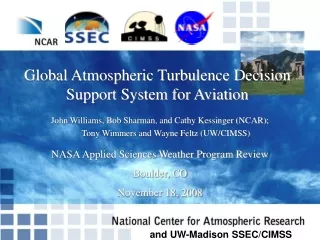
Global Turbulence Nowcast and Forecast System. John K. Williams , Bob Sharman, and Cathy Kessinger (NCAR) Wayne Feltz and Tony Wimmers (UW-Madison/CIMSS) . Briefing to FAA and Airline Industry Representatives 8 April 2010. ational Center for Atmospheric Research.

E N D
Global Turbulence Nowcast and Forecast System John K. Williams, Bob Sharman, and Cathy Kessinger (NCAR) Wayne Feltz and Tony Wimmers (UW-Madison/CIMSS) Briefing to FAA and Airline Industry Representatives 8 April 2010 ational Center for Atmospheric Research and UW-Madison SSEC/CIMSS
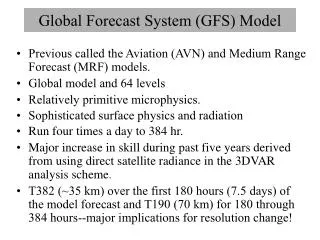
Motivation Unexpected turbulence continues to cause passenger and crew injuries and aircraft damage Sparse flights, few weather observations and limited communications limit information available to pilots on oceanic routes Current World Area Forecast System (WAFS) operational products have inadequate accuracy, temporal and spatial resolution Large SIGMET areas may be difficult to circumnavigate Ellrod index Does not capture all turbulence mechanisms Doesn’t explicitly address convective turbulence Probabilistic hazard assessment is needed WAFS international SIGMETs (4-hr updates) SIGWX facsimile chart (6-hr updates)
Global Turbulence DSS Goals Extend U.S. FAA/NWS “Graphical Turbulence Guidance” to global domain for World Area Forecast System (WAFS) Provide statistical and deterministic hazard assessment Data fusion to address all major known turb. mechanisms Gridded 1/3 horizontal resolution, 10,000 – 45,000 ft Tactical turbulence and convection nowcasts (0-3 hours) for avoidance/ mitigation Strategic turbulence forecasts (3-36 hours) for planning and route selection LGT MOD SEV EXT SM Web-based graphical display Cockpit uplink and display
Global Turbulence Data Fusion: Sources Clear-air turbulence (CAT) Global Forecast System (GFS) model-derived “diagnostics” “Tropopause fold” identification from model and satellite data Mountain-wave turbulence (MWT) Model winds and terrain data Satellite gravity wave identification and features Downslope wind conditions Convectively-induced turbulence (CIT) Model fields related toclouds/storms and stormenvironment Storm characterization from satellite data Cloud top heights Overshooting tops Convection diagnosis (CDO) and nowcasts (CNO) based on model + satellite observations CAT MWT CIT
Global In situ Turbulence “Truth” United EDR above 10,000 ft MSL07-01-2008 to 07-15-2008 Delta EDR above 10,000 ft MSL07-01-2008 to 10-31-2008 Ude, various airlines11-1-2008 to 11-10-2008 AIREPs, various airlines 11-1-2008 to 11-10-2008 Additional global turbulence measurements would be helpful….
- NVA UBF FRNTGth DTF3 Ellrod1 Ri NCSU1 CLIMO NCSU2 GTG TEMPG EDRS10 VWS Model-based Turbulence Diagnostics CONUS GTG = Dynamic weighted fusion of multiple turbulence diagnostics 0 h forecast valid 1500 UTC 22 September 2006 Operational GTG: http://adds.aviationweather.gov/turbulence/ Experimental GTG: http://weather.aero/turbulence
Global CAT Diagnostics Based on GFS Model Ellrod index FL350 EDR index FL350 Ri from thermal wind FL200 Note: breaks down at equator 6 hr forecast valid 18 UTC 4 Nov 2008 RUC-based diagnostics GFS-based diagnostics
Global GTG Prototype (4-day loop) Global GTG analyses 14-17 December 2007, ~35000 ft
Tropopause Fold Diagnosis 14 150 stratosphere 12 200 subtropical air mass 10 300 Pressure (hPa) Height (km) 8 tropopause 400 6 500 600 4 polar air mass 700 (~100 km) front • TF a source of CAT • Identified via gradients in satellite water vapor channel along with GFS model data • Verified with Aqua Ozone Mapping Instrument GLASH humidity with trop. folds Tropopause folds with altitudes Illustration of tropopause fold mechanism
Mountain-Wave Turbulence • Diagnostics from low-level winds and terrain • Working on algorithm to identify presence, interference of gravity waves from satellite water vapor channel • NWP data may help distinguish conditions under which wave breaking/turbulence is likely MODIS 1-km 6.7 m, 6 March 2004 Experimental “wave interference scale”
Convectively-induced Turbulence (CIT) • CIT can be patchy (few km) and dynamic (few minutes) • Some mechanisms are known • Shears caused by updrafts, downdrafts,anvil outflow • Gravity waves produced by overshooting tops • Diagnose using data fusion of observations, nowcasts + NWP models Simulation: Cloud (blue), turbulence (red)Courtesy of Dr. Todd Lane
Inferring CIT: Overshooting Tops Overshooting Tops in AF 447 case Frequency of turbulence vs. OT distance
Other Possible Satellite CIT Signatures Rapid Anvil Expansion Banded Cirrus Outflow Rapid Convective Growth
Convective Diagnosis Oceanic (CDO) (Lightning) GOES-East CTOP CTOP CClass CClass GCD GCD CDO Interest Field (0-4 day, 0-3 night) CDO Binary Product Threshold = 2.5 Interest Fields (0-1)
Global Turbulence and Convection Global GTG – 12 hr Forecast Convective Diagnosis Oceanic Pilot and InSitu Reports +90 min Global GTG – 12 hr Forecast Convective Diagnosis Oceanic Global GTG – 12 hr Forecast • Goal: produce a comprehensive turbulence hazard product via empirical AI fusion of model and satellite-derived features
Statistical Data Fusion Methodology Random Forest (RF): A non-linear data mining technique used to analyze retrospective data and create a non-parametric (makes no assumptions about functional form), probabilistic empirical predictive model via an ensemble of decision trees Data pt. Data pt. Data pt. Data pt. Data pt. Tree 2 Tree 3 Tree 100 Tree 1 Tree 4 … Vote: 0 Vote: 0 Vote: 0 Vote: 1 Vote: 1 => 40 votes for “0”, 60 votes for “1”
Statistical Evaluation: Moderate-or-greater turbulence (EDR ≥ 0.3 m2/3s-1) • Based on June 27 – August 23, 2007, GOES-E and RUC-13, United in situ peak EDR as truth, alt. 10 kft • Note that adding model and satellite fields substantially improves nowcast skill
Statistical evaluation: MoG turbulence Receiver Operating Characteristic Curves GTG+model+satellite
Schedule Initial Global Turbulence nowcast prototype with CIT and CAT running this summer Oceanic uplink demonstration of customized text messages planned with United Airlines Other participants welcome if no major system changes required
Previous uplink demo of CONUS NTDA (in-cloud turbulence) funded by FAA 2005-2007 Flight information • /EXPERIMENTAL TURBULENCE FI UAL███/AN N███UA UPLINK • -- 05 Sep 2006 21:38:13Z FL 300 orient. 83 deg • '+'=waypoint, '*'=route, 'X'=aircraft at 38.3N, 80.6W • ' '=no_data, 'o'=smooth, 'l'=light, 'M'=mod, 'S'=severe • -----------------------(52 to IAD)------------------------ • | * • | * • MM | * • MM | * • MM | l lll M * • MMM | lollo * • lMl | oolo * • l | oo * • | * • |080 * • M |llllllll ll * • MM |lllllllllllllll l * • lll |lllllllllollllllll * • MMl l |MMllllllllooollllll * • MMl l |MMMl lllllllllollll * • MM l |MMMM llll llol ll * • MM | MMMM ll * • MMS | MMM * • MSS | MM * • MSS +PUTTZ + • MSS | * SSSSSS • MSS M | l S*SSSSSSSSS • MSS M | lllS*SSSMSSSSS • MSS l | lSMS*SMMMMSSSS • MSS l | SSMM*MMMMMMMM • MSS M | MM*SMMMMMMMMlllll • MSS M | M*SSMMMMMMMMllllll • MMM M | *MMMMMMMMMMMMMllll • MMM | * MMlllMMMlMllllllM • lll |040 * lllllllllllllllllMMl • lll | * llllllllllllll • llS | * llllllllll • MMS | * lllllll • SSS | * lllll • SSS | * lll • MMS | * l ll • MM | * • MM M | MM*MM o • MSS | SM*MM • MMM | MM *MM l • MM | MMMSS S * l l • lM | MMMSSM * lllllll o • l |l MMMM * lllllo • | MMMMM * llllll • | M * lllll • | SSS * llll • ll | SSS M l * l • lll | SSS Mlllll * • llM | MM lMlllll * l • -------|---------valid-|--------X--------|---------------- • -90 +90|Left 40 2135Z (18 from 3819N/8058W) Right 40 Legend • Pilot registration and feedback via NCAR web page • Pilot feedback mostly very positive Route Waypoint Severe turbulence Moderate turbulence Aircraft position Vertical cross-section
Combining Turbulence and CTOP Uplink ProductsConcept Version 1.1 • Planview • Derived from global turbulence product • O = null • L = light • M = moderate • S = severe • Use lower case letters when in-cloud; upper case for out-of-cloud
Combining Turbulence and CTOP Uplink ProductsConcept Version 1.2 | | | | 0| 1| 1| 1| 1| 2| 2| 1| 1| 2| 2| 3| 3| 3| 2| 2| 2| 2| 2| 3| 3| 3| 3| 2| 2| • Planview + vert. cross section • Derived from global turbulence product • O = null • L = light • M = moderate • S = severe • Use lower case letters when in-cloud; upper case for out-of-cloud • Add maximum cloud top height as a vertical cross section • 0 = 25-30kft • 1 = 30-35kft • 2 = 35-40kft • 3 = >40kft
Combining Turbulence and CTOP Uplink ProductsConcept Version 2.1 • Planview + vertical cross section • Cloud top height uplink • / = 30-40 kft • C > 40 kft • Add global turbulence intensity as a vertical cross section
Acknowledgements This research is supported by NASA, primarily under Grant No. NNX08AL89G. Any opinions, findings, and conclusions or recommendations expressed in this material are those of the authors and do not necessarily reflect the views of the National Aeronautics and Space Administration. • Collaborators include • Jenny Abernethy, Gary Blackburn, HuaqingCai, Jason Craig, Bill Hall, David Johnson, Frank McDonough, Dan Megenhardt, Greg Meymaris, Nancy Rehak, Matthias Steiner, and Stan Trier at NCAR • Michael Donovan and Earle Williams at MIT Lincoln Laboratory • Richard Bankert and Jeffrey Hawkins at Naval Research Laboratory-Monterey • Todd Lane at University of Melbourne