Download
1 / 11
120 likes | 240 Views
Santa Ana River Watershed Wasteload Allocation Model 2008. March 25, 2009. Project Scope. Task 1: Develop Calibration Hydrology Task 2: Calibrate WLAM Task 3: Develop Future Planning Scenarios Task 4: Evaluate Wasteload Allocation Simulations Task 5: Documentation. Today.

E N D
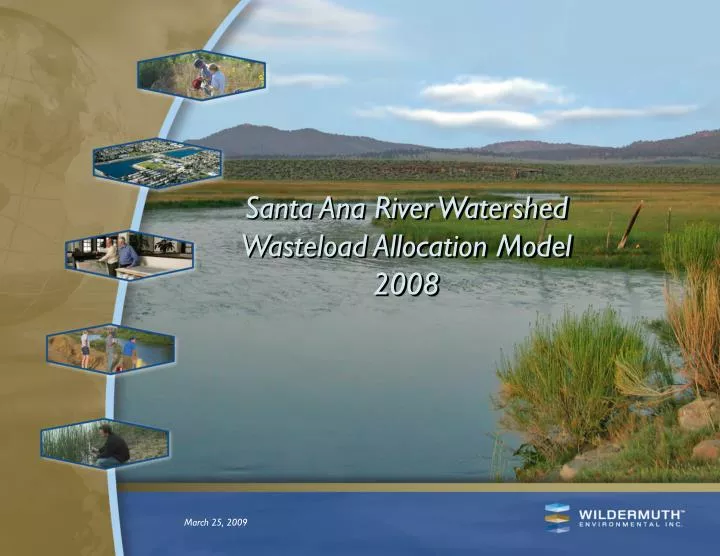
Santa Ana River WatershedWasteload Allocation Model2008 March 25, 2009
Project Scope • Task 1: Develop Calibration Hydrology • Task 2: Calibrate WLAM • Task 3: Develop Future Planning Scenarios • Task 4: Evaluate Wasteload Allocation Simulations • Task 5: Documentation
Today • Wasteload allocation simulation results and conclusions • Review draft report comments and response to comments
Review of Scenarios • Scenario 2 • Minimize discharge to SAR for permit TDS < 580 mg/L • Maximize discharge to SAR for permit TDS > 580 mg/L • Include pending Muni/WMWD diversion • Scenario 3 • Same as Scenario 2 w/o Muni/WMWD diversion • Scenario 4 • Assume no recycling and maximum plant discharge
Review of Scenarios (cont) • Scenario 5 • Planned POTW recycled water discharge and reclamation • Scenario 6 • Planned POTW recycled water discharge and reclamation • EMWD discharge TDS increased from 650 mg/L to 700 mg/L • WMWD added March Wastewater Reclamation Facility discharge via Hole Lake • 2010: 2.3 MGD, 2020 4.3 MGD • TDS: 550 mg/L, TIN: 6 mg/L-N
Results and Conclusions • Scenario 2 - Worst Case POTW Discharge with the Seven Oaks Diversion: this scenario brackets all scenarios except Scenario 4, the maximum mass discharge. • Based on estimated TDS and TIN concentrations for the August only, 1-year volume-weighted average, and 5-year volume-weighted average compliance periods, there is little difference between simulations with and without the Seven Oaks diversion. • Scenario 4 – Maximum Mass Discharge: this scenario results in the highest 1-year and 5-year volume-weighted TDS and TIN concentrations.
Results and Conclusions (cont) • Based on estimated TDS and TIN concentrations for compliance metrics, there is little difference between Scenario 5 and Scenario 6 • Bunker Hill B: exceeds the TDS objective in all modeled scenarios and has TDS assimilative capacity. • Riverside A: exceeds the TIN objective in all modeled scenarios and has TIN assimilative capacity. • Chino South mz: all scenarios exceed TIN objective and there is no assimilative capacity for TIN.
Comments • 27 comments from four agencies • 19 comments resulted in text changes or additions • Key clarifications: • Table 2-7 • Parks and schools impervious area was listed as 80% in table only. • Table 2-5 • Land use types were incorrectly linked with land use Anderson codes in the table only during report preparation • Table 4-5 • Data for Scenario 6 not Scenario 5 as in table header • EMWD discharge = 700 mg/L not 650 mg/L as shown