Download
1 / 14
140 likes | 206 Views
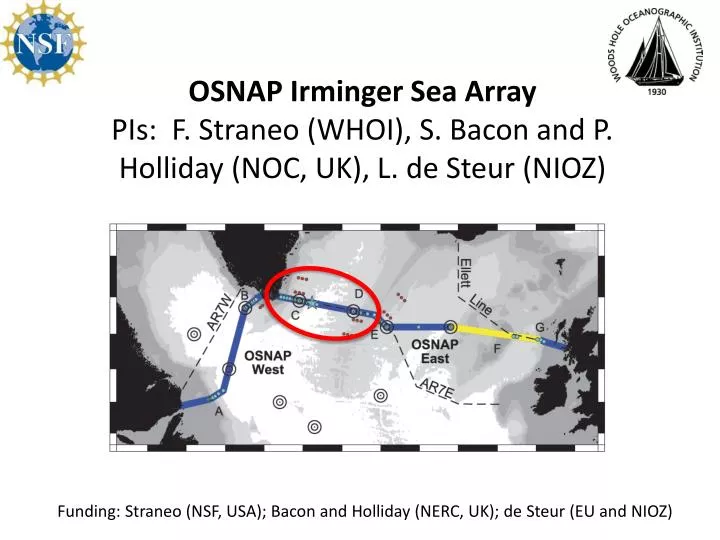
OSNAP Irminger Sea Array PIs: F. Straneo (WHOI), S. Bacon and P. Holliday (NOC, UK), L. de Steur (NIOZ). Funding: Straneo (NSF, USA); Bacon and Holliday (NERC, UK); de Steur (EU and NIOZ). Irminger Sea – A key region for climate variability. MODIS SST AUGUST 2003.

E N D
OSNAP Irminger Sea ArrayPIs: F. Straneo (WHOI), S. Bacon and P. Holliday (NOC, UK), L. de Steur (NIOZ) Funding: Straneo (NSF, USA); Bacon and Holliday (NERC, UK); de Steur (EU and NIOZ)
Irminger Sea – A key region for climate variability MODIS SST AUGUST 2003 • Convergence of Arctic, Atlantic, Intermediate and Dense Waters • Freshwater transport into the subpolar region • Large air/sea exchange: Intermediate Convection • Transformation of the dense overflows • Supply of warm ocean waters to Greenland’s outlet glaciers
Large-Scale Circulation Dynamic Topography AVISO Surface Velocity AVISO From Vage et al. 2011
Variability Irminger Sea Holte et al., in preparation
OSNAP ARRAY IRMINGER SEA Streamlines (blue) 700m flow from Lavender et al. 2000 Arrows – 100m averaged velocity from Vage et al. 2011 climatology
OSNAP ARRAY IRMINGER SEA NIOZ WHOI UK Climatol. ar7e section Vage et al. 2011
East Greenland Current and Coastal Current Salinity Schematic – Vage et al. 2011 Velocity Sutherland and Pickart 2008
East Greenland Irminger Current Mean Velocity – French Array OVIDE Array 2004-2006 Daniault et al. 2011
Deep Western Boundary Current Moored Array 2005-2007 Bacon and Saunders, 2010
OSNAP ARRAY IRMINGER SEA Streamlines (blue) 700m flow from Lavender et al. 2000 Arrows – 100m averaged velocity from Vage et al. 2011 climatology
East Greenland Irminger Current and Deep Western Boundary Current Instrumentation WHOI Arrays – Upward looking ADCPs on shelf and at 100m on IC moorings CTD and CM 6-8 CTDs/CM on each mooring (except shelf) UK Arrays – 6 CTDs/CMs on 1500m moorings, 10 CTDs/CMs on tall mooring Climatological ar7e section from Vage et al. 2011
OSNAP AND OOI Climatological ar7e section from Vage et al. 2011
Velocity Sections Data courtesy of P. Lherminier (IFREMER) Vage et al. 2011