Download
1 / 83
830 likes | 986 Views
IPCC Working Group I: Chapter 6. Paleoclimate. Jim Kinter 18 Feb 2010. WHAT IS CLIMATE? . WHAT IS CLIMATE? . WEATHER. WHAT IS CLIMATE? . WEATHER. CLIMATE. WHAT IS CLIMATE? .

E N D
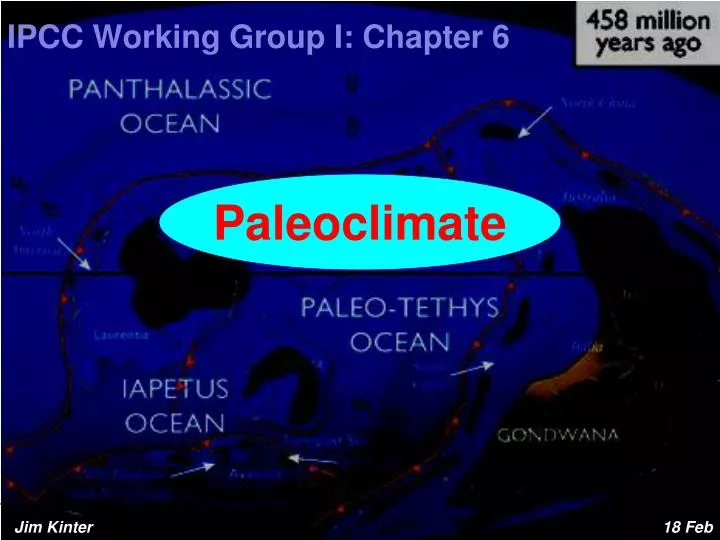
IPCC Working Group I: Chapter 6 Paleoclimate Jim Kinter 18 Feb 2010
WHAT IS CLIMATE? WEATHER
WHAT IS CLIMATE? WEATHER CLIMATE
WHAT IS CLIMATE? Climate is a statistical representation of the slowly-varying conditions in the atmosphere, oceans and land surface during a given epoch of geologic time (the study of climate is a branch of the geosciences)
WHAT IS CLIMATE? Climate is a statistical representation of the slowly-varying conditions in the atmosphere, oceans and land surface during a given epoch of geologic time (the study of climate is a branch of the geosciences) AGE OF DINOSAURS FORMATION OF “FOSSIL FUELS” (?)
WHAT IS CLIMATE? Climate is a statistical representation of the slowly-varying conditions in the atmosphere, oceans and land surface during a given epoch of geologic time (the study of climate is a branch of the geosciences) QUATERNARY - LAST ~2 MILLION YEARS: FOCUS OF “RECENT” CLIMATE
Questions for Paleoclimate Studies – Obs & Methods • How has climate varied before the historical record, and how do we know? • What are the "proxies" of climate that can be observed by examining geologic and other records? How can we date these proxies? • Is there evidence of climate change in the pre-monitoring past that is similar to what is being observed today in terms of magnitude and rapidity of fluctuation? • Is there evidence of a direct link between greenhouse gas concentrations and other climate indicators (temperature, moisture, etc.)? Can a cause-effect relationship be inferred from the available evidence? E.g., is there a lead-lag relationship between CO2 and glacial changes? • How good are the paleoclimatic "proxies"? What temporal resolution? How representative of the globe? Seasons? Can we quantify the timing and/or magnitude of paleoclimatic changes?
A Word About Notation • Ka (or ka) Thousands of years before present • Ma Millions of years before present • Ga Billions of years before present • Examples: Current interglacial period began 14 ka • Earth was formed 4.5 Ga
Evidence of Past Climates • Remote sensing from satellites (global; since 1979) • Instrumental surface record (mostly land points; since 1860) • Diaries, written records of flood, harvest, ice (spotty; 1 ka) • Proxy records (spotty) • Tree Rings or dendrochronology (100 - 5 ka) • Lake Cores, Packrat Middens (100 a - 10 ka) • -- sediments, varves, pollen, seeds, C14 (5730 a) • Ice Cores (100 a - 600 ka) • -- CO2 bubbles, dust deposits, dO18 • Loess Deposits (100 a - 100 ka) • -- aeolian dust (windblown silt and clay), strata • Ocean Cores (1 ka - 1 Ma) • -- sediments, mud, isotopes • Sedimentary Rocks (1 ka - 100 Ma) • -- fossils, strata
C14 dating proxy Radioactive C14 (unstable isotope of carbon; C12 is stable isotope) is produced in the atmosphere by cosmic ray bombardment. It has a half-life of 5730 years and constitutes about one percent of the carbon in an organism. When an organism dies, its C14 continues to decay. The older the organism, the less C14. dO18 temperature proxy Both O18 and O16 are stable isotopes of oxygen. Since O18 has two more neutrons than O16 water (H2O) containing O18 is heavier, harder to evaporate (isotope fractionation). As temperature decreases (in an ice age), snow deposits contains less O18 while ocean water and marine organisms (CaCO3) contain more O18. The O18 / O16 ratio or dO18 in ice and marine deposits constitutes a proxy thermometer that indicates ice ages and interglacials. Low O18 in ice indicates it was deposited during cold conditions worldwide, while low O18 in marine deposits indicates warmth.
QUATERNARY - LAST ~2 MILLION YEARS: ICE AGES, MODERN AGE Warm and Cold Periods in Earth History AGE OF DINOSAURS FORMATION OF “FOSSIL FUELS”
S, , a, g, Ω O3 H2O CO2 Ω CLIMATE DYNAMICS OF THE PLANET EARTH g a (albedo) Gases: H2O, CO2, O3 S T4 h*: mountains, oceans (SST) w*: forest, desert (soil wetness) CLIMATE . stationary waves (Q, h*), monsoons WEATHER hydrodynamic instabilities of shear flows; stratification & rotation; moist thermodynamics day-to-day weather fluctuations; wavelike motions: wavelength, period, amplitude
5 Billion Years (Ga)(all of Earth history) • Mechanisms: Galactic dust , Evolution of the Sun, Evolution of the Atmosphere
Earth’s Climate through Geologic Time • Carbon Cycle • Faint Sun Paradox • Ice-Covered Earth? • Pre-Quaternary Eras • Pre-Cambrian (Proterozoic) • Paleozoic • Mesozoic • Cenozoic (Tertiary) • Continental Drift • Origin of Warmth During Cretaceous (Mesozoic) • Asteroid Impact
Carbon Cycle • Carbon is present in several forms on Earth. It is stored in several large reservoirs and is transported among the reservoirs by various processes. There are two principle modes of cycling carbon: organic and inorganic. • Organic carbon cycle: • 6 CO2+ 6 H2O + hC6H12O6+ 6 O2 • photosynthesis • respiration • C6H12O6 + 3 CO2 + 3 CH4 • anaerobic fermentation • NET: 3 CO2 + 6 H2O 3 CH4 Inorganic carbon cycle: CO2 + H2O H2CO3 formation of carbonic acid H2CO3 H+ + HCO3- bicarbonate ion HCO3- H+ + CO3-- carbonate ion CaCO3 + H2CO3 Ca++ + 2HCO3- Calcium carbonate (calcite) weathering CaSiO3 + 2H2CO3 Ca++ + 2HCO3- + SiO2 + H2O silicate weathering (consumes 2X carbon) Ca++ + 2HCO3 CaCO3 + H2CO3 carbonate precipitation in shells NET: CaSiO3 + CO2 CaCO3 + SiO2
Carbon Cycle • Organic carbon cycling: Net results molecular oxygen (O2) and methane (CH4). The transitions from one side to the other of these equilibria are primarily associated with plant respiration and decay of plant matter by microbial consumption, and are relatively fast, on geologic time scales. • Inorganic carbon cycling: Net result - equilibrium between wollastonite (CaSiO3) plus CO2and calcium carbonate plus silicate (sand or quartz; SiO2). • CaSiO3 + CO2 CaCO3 + SiO2 • The three minerals exist in equilibrium with CO2. Weathering at the Earth’s surface drives the equilibrium to the right favoring calcium carbonate and silicate. Metamorphosis, usually by subduction of tectonic plates, drives the equilibrium to the left, favoring wollastonite and CO2. This process occurs slowly on geologic time scales.
Faint Sun Paradox (Archaen Period) • The solar “constant” is 30% larger today than it was 4.5 Ga due to evolution of Sun (thermonuclear transformation from H to He makes core denser and hotter). • BUT • We have no evidence of glaciation before ~2.3 Ga • (running water on Earth, Mars surfaces for billions of years) • THEREFORE • Feedbacks are required! • Candidates include: • Bolide impacts heating • More volcanism outgassing of CO2 • Smaller continents • Reduced weathering more CO2 • Lower albedo (less surface for land ice) • Less biota more CO2
Ice-Covered Earth? (Proterozoic Period) • There is evidence of a snow- or ice-covered tropics at ~700 Ma … possibly • due to very low values of CO2 associated with rapid, unchecked weathering • in tropics. • If the Earth was ice-covered at some time, how did it become ice-free? • Possibility: Some geologic evidence suggests that the tropics were glaciated about 0.5-1.0 Ma • Hypothesis (Kirshvink, 1992): Plate tectonics increases CO2 in the atmosphere through metamorphosis of calcium carbonate and silicate subduction (see carbon cycle discussion). In the absence of weathering and/or photosynthesis to remove CO2 from the atmosphere, CO2 builds up to sufficiently high levels to melt the ice. • Evidence: Thick layers of carbonate are found on top of evidence of tropical glaciation • Evidence: banded iron formations are found at the time of the tropical glaciation which could be due to an abundance of sea ice tropical oceans anoxic large iron solutions in oceans that sediment out as iron oxide (rust) when oceans become ice-free • Implication: The era of “iceball Earth” lasted ~107 years and was followed by rapid transition to very warm climate large forcing changes on life forms over evolutionary time scales
Other Pre-Quaternary Eras • Pre-Cambrian (Proterozoic): 2.7-0.6 Ga • Evidence of first glaciation at ~2.5 Ga • Issue: No evidence of glaciation between 2.5 and 0.9 Ga, even though Sun was faint • Evidence of three major glaciations at 950, 750 and 610 Ma with ice occurring at low latitudes (paleomagnetic evidence) • Paleozoic: 570 – 225 Ma • Generally mild climate with two phases of ice • Mesozoic: 225 – 65 Ma • Period of the dinosaurs • Generally non-glacial climate due to land-sea distribution and (possibly) high CO2 • Cenozoic (Tertiary): 65 – 3 Ma • Sequential cooling and drying due to: • Uplift of Tibetan Plateau and Rockies/Andes cordillera • Changes in CO2 - Paleocene-Eocene Thermal Max • Changes in ocean heat transport
Paleocene-Eocene Thermal Max Records in benthic (bottom dwelling) foraminifer (Nuttallidestruempyi) isotopic records from sites in the Antarctic, south Atlantic and Pacific show: Rapid decrease in carbon isotope ratios * Top: large increase in GHG (CO2and CH4) * Middle: 5°C global warming CH4released by rapid decomposition of marine hydrates might have been a major component (~2,000 GtC) of the carbon flux. Much of the additional greenhouse carbonwould have been absorbed by the ocean, thereby lowering seawater pH and causing widespread dissolution of seafloor carbonates (bottom panel). Ocean’s carbonate saturation horizon rapidly shoaled more than 2 km, and then gradually recovered as buffering processes slowly restored the chemical balance of the ocean. (AR4 - Fig. 6.2) Benthic foraminifera
Continental Drift • As continents drift toward the poles, land serves as a platform for ice formation cooler climate • Continents can drift apart to open ocean currents, e.g., the Southern Ocean opened when Antarctica separated from South America reduced oceanic heat transport cooler climate • Continents can drift together closing off ocean currents, e.g., the isthmus of Panama formed when North and South America came together, cutting off the flow from west to east strengthening Gulf Stream increased oceanic heat transport warmer climate • Uplift of Tibetan Plateau Indian monsoon • Increased rainfall in south Asia, southeast Asia • Increased subsidence & less rainfall over Mediterranean • Warm rain perturbs carbon cycle (more weathering), so that, on time scales of 106 years, atmospheric CO2 concentration is determined by balance of weathering and metamorphosis (subduction) • Increased sea floor spreading • increased volcanism increased CO2 • increased sea area, decreased land area decreased weathering increased CO2 • BREAK FOR CLIMAP SLIDESHOW
Origin of Warmth During Cretaceous(65-130 Ma) • Climate models used with various boundary conditions (SST, geography etc.) assumed to be prevalent during Cretaceous cannot explain high latitude warmth • THEREFORE • Need higher CO2 (as much as 4X to 8X current level) • Higher rate of volcanism • 20% less land area • Higher CO2 implies three feedbacks: • Higher water vapor concentration increased latent heat transport to high latitudes • Decreased meridional temperature gradient decreased sensible heat transport to high latitudes • Thermal expansion of sea water increased oceanic heat transport to high latitudes
PRE-QUATERNARY CLIMATE (Top) Global compilation of deep-sea benthic foraminifera 18O isotope records from 40 Deep Sea Drilling Program and Ocean Drilling Program sites. After the early Oligocene much of the variability (~70%) in the 18O record reflects changes in Antarctic and Northern Hemisphere ice volume, which is represented by light blue horizontal bars. Where the bars are dashed, they represent periods of ephemeral ice or ice sheets smaller than present, while the solid bars represent ice sheets of modern or greater size. (Bottom) Detailed record of CO2 for the last 65 Myr. Individual records of CO2 and associated errors are color-coded by proxy method; when possible, records are based on replicate samples. Dating errors are typically less than ±1 Myr. Also plotted are the plausible ranges of CO2 from three geochemical carbon cycle models. (AR4 - Fig. 6.1)
Asteroid Impact • When a large rocky object (bollide) collides with the Earth, very large perturbations are introduced. • On climate scales, there are short-term and long-term consequences. • Initially, the kinetic energy of the bollide is transferred to the atmosphere sufficient to warm the global mean temperature near the surface by 30 K over the first 30 days after the impact. • The ejecta that are thrown up by the impact return to Earth over several days to weeks produce radiative heating of the atmosphere sufficient to ignite global wildfires that kill most large vertebrates. • Over several weeks to months, a global cloud of dust obscures the Sun, cooling the Earth’s surface, effectively eliminating photosynthesis and stabilizing the atmosphere to the degree that the hydrologic cycle is cut off. • The sum of these effects together could kill most flora. The latter results in extinction up the food chain and a large increase in atmospheric CO2, enabling a large warming of the climate in the period after the dust cloud has settled back to Earth. • This is hypothesized to have happened at the Cretaceous-Tertiary boundary (65 Ma) that coincided with a very large mass extinction of a multitude of species, including the dinosaurs.
180 Ma • Mechanisms: Evolution of the Atmosphere, Plate Tectonics, Mountain Building, Volcanic Activity, Solar Variability, Ocean Circulation
1 Ma • Mechanism: Orbital Parameters
120 ka • Mechanism: Orbital Parameters
James Croll (1821-1890) Leading proponent of an astronomical theory of climate change in the 19th century. Checkered career including caretaker at Andersonian College and Museum in Glasgow and secretary and accountant for the Scottish Geological Survey. Theory of ice ages took into account variations in orbital eccentricity, precession of the equinoxes, and obliquity of the ecliptic. Pioneer in Climate Dynamics. Feedback mechanisms -- radiative effects of the ice fields, enhanced formation of cloud and fog, changes in sea level, and the mixing and redirection of warm and cold ocean currents enhance the climatic changes initiated by the orbital elements.
MilutinMilankovitch (1879-1958) Leading proponent of an astronomical theory of climate changein the 20th century. Worked in Serbia under extreme duress including incarceration in 1914 by the Austro-Hungarian Army and the bombing of Belgrade (and his publisher!) in 1941. Calculated mathematically the timing and influence at different latitudes of changes in orbital eccentricity, precession of the equinoxes, and obliquity of the ecliptic. This theory was confirmed in 1976 in the paleoclimatic proxy record, so Milankovitch cycles became known as the pacemaker of the ice ages.
Energy Received From Sun Varies On Geologic Time Scales Earth orbit variability
Highly Elliptical Almost Circular • Orbital eccentricity (96,000 years) • Large e --> 20% energy difference between S and W • Largeealso changes the length of the seasons • Small e--> 7% energy difference between S and W
Polar tilt or Obliquity of the ecliptic (42,000 years) • 21.5 to 24.5 is the range -- currently 23.5 • Small tilt = less seasonal variation • cooler summers (less snow melt), warmer winters (more snowfall)
Polar wobble or Precession of equinoxes (24,000 years) • Vernal equinox has 24 Ka period around the orbit. • “Wandering” pole star. • Caused by Moon’s gravitational pull on Earth’s equatorial bulge.
Polar Wobble (Precession of the Equinoxes) and Polar Tilt ±12,000 years 21 June 21 December
Solar Radiation Received and Earth Orbital Parameters Total Insolation (solar radiation) Eccentricity (96 Kyrs) Obliquity (42 Kyrs) Precession (24 Kyrs)
Box 6.1, Figure 1 DJF Annual mean (Left) December to February (top), annual mean (middle) and June to August (bottom) latitudinal distribution of present-day (year 1950) incoming mean solar radiation (W m–2). (Right) Deviations with respect to the present of December to February (top), annual mean (middle) and June to August (bottom) latitudinal distribution of incoming mean solar radiation (W m–2) from the past 500 ka to the future 100 ka. (AR4 - Box 6.1, Fig. 1) JJA Present day
Power Spectrum shows Milankovitchcycleshttp://geography.otago.ac.nz/OnlineCourses/Climate_Change_The_Past/Resources/milankovitch.html
Ice Age • Milankovitch cycle gives minimum insolation • Glaciers advance • Lower sea levels • Lower sea surface temperatures • Reduced evaporation and precipitation • Polar front moves south • Salinity increases • Thermohaline circulation increases • Nutrients and biological productivity increase • Deep water sequesters CO2 from atmosphere • Cooling due to expanding ice caps and decreased CO2
Last Glacial Maximum: 22-14 ka • NH: Laurentide and Fennoscandian ice sheets • 3.5 – 4 km thick • 50-60 x 106 km3 water • 120 m sea level reduction • 700 – 800 m crustal depression (currently in post-glacial isostatic adjustment of about 1 cm/year) • Large changes in flora and fauna • Most of planet equatorward of ice sheets: • colder and drier • wind speed 20 – 50% higher • higher dust levels • lower CO2 concentration (~200 ppm) and CH4 concentration feedback
DANSGAARD-OESCHGER AND HEINRICH EVENTS The evolution of climate indicators from the NH (panels a to d), and from Antarctica (panels e to g), over the period 64 to 30 ka. (a) Anhystereticremanentmagnetisation (ARM), a proxy of the northward extent of Atlantic MOC, from an ocean sediment core from the Nordic Seas. (b) CH4 as recorded in Greenland ice cores at the Greenland Ice Core Project (GRIP), Greenland Ice Sheet Project (GISP) and North GRIP (NGRIP) sites. (c) Surface temperature estimated from nitrogen isotope ratios that are influenced by thermal diffusion. (d) d18O, a proxy for surface temperature, from NGRIP (2004) with the D-O NH warm events 8, 12, 14 and 17 indicated. (e) 18O from Byrd, Antarctica with A1 to A4 denoting Antarctic warm events. (f) NSS-Ca2+, a proxy of dust and iron deposition, from Dome C, Antarctica; and (g) CO2 as recorded in ice from Taylor Dome, Antarctica. The Heinrich events (periods of massive ice-rafted debris recorded in marine sediments) H3, H4, H5, H5.2, and H6, are shown. CH4 variations are synchronous within the resolution of ±50 years with variations in Greenland temperature, but a detailed analysis suggests that CH4 rises lag temperature increases at the onset of the D-O events by 25 to 70 years. The evolution of Greenland and Antarctic temperature is consistent with a reorganization of the heat transport and the MOC in the Atlantic. (AR4 - Fig. 6.7) Figure 6.7
Interglacial (Holocene) • Milankovitch cycle gives maximum insolation • Glaciers retreat • Higher sea levels • Higher sea surface temperatures • Enhanced evaporation and precipitation • Polar front moves north • Salinity decreases • Thermohaline circulation decreases • Nutrients and biological productivity decrease • Deep water releases CO2 to atmosphere • Warming due to shrinking ice caps and increased CO2 • Abrupt warming: one of most rapid transitions • Interrupted by brief period of cold – Younger Dryas (~11 ka) • Continuation of warming beginning in ~10 ka
Figure 6.8 SEA LEVEL CHANGE (A) The ice-equivalent eustatic sea level history over the last glacial-interglacial cycle. The smooth black line defines the mid-point of their estimates for each age and the surrounding hatched region provides an estimate of error. The red line is the prediction of the ICE-5G(VM2) model for the Barbados location. (B) The fit of the ICE-5G(VM2) model prediction (red line) to the extended coral-based record of RSL history from the island of Barbados in the Caribbean Sea over the age range from 32 ka to present. The actual ice-equivalent eustatic sea level curve for this model is shown as the step-discontinuous purple line. The individual coral-based estimates of RSL (blue) have an attached error bar that depends upon the coral species. The data denoted by the coloured crosses are from the ice-equivalent eustatic sea level reconstruction for Barbados (cyan), Tahiti (grey), Huon (black), Bonaparte Gulf (orange) and Sunda Shelf (purple). (AR4 - Fig. 6.8)
Climate Reconstructions: Last 1800 years [Jones and Mann, 2004, Reviews of Geophysics]. Model-based estimates of northern hemisphere temperature variations over the past two millennia. Shown are 40 year smoothed series. The simulations are based on varying radiative forcing histories employing a hierarchy of models including one-dimensional energy based models (Crowley, 2000), two-dimensional reduced complexity models (Bauer et al, 2003; Bertrand et al, 2002; Gerber et al, 2003), and full three-dimensional coupled atmosphere-ocean general circulation (’GKSS’-Gonzalez-Rouco et al, 2003; ‘CSM’–Ammann et al., submitted). Shown for comparison is the instrumental northern hemisphere record 1856-2003 (Jones et al, 1999), and the proxy-based estimate of Mann and Jones (2003) extended through 1995, with its 95% confidence interval. Models have been aligned vertically to have the same mean over the common 1856-1980 period as the instrumental series (which is assigned zero mean during the 1961-1990 reference period).