Download
1 / 33
330 likes | 538 Views
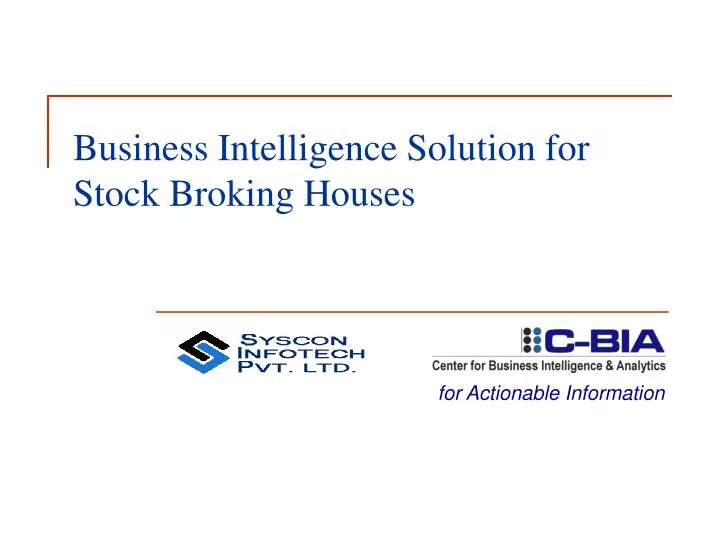
Business Intelligence Solution for Stock Broking Houses. for Actionable Information. Agenda. About C-BIA Business Intelligence Solution for Stock Broking Business XLDashBoard – Demonstration. Center for Business Intelligence and Analytics (C-BIA). for Actionable Information. Mission.

E N D
Business Intelligence Solution for Stock Broking Houses for Actionable Information
Agenda • About C-BIA • Business Intelligence Solution for Stock Broking Business • XLDashBoard – Demonstration
Center for Business Intelligence and Analytics (C-BIA) for Actionable Information
Mission “Create business value for clients by enabling superior performance through unleashing hidden wealth in operational and external data sources combined with innovative Analytics.”
History C-BIA, a division of TechKnit was founded in 2004 Cyrus Mehta, Ph.D. Founder and President Cytel Inc. Nitin Patel, Ph.D. Founder and Chairman Cytel Inc. www.cytel.com Statistical Software, Consulting and Services for Clinical Trials BI Solutions and Analytics Services e-Tutoring and Educational Content
Team of 40 people in Pune, consisting of: Business Analysis and Solution Design (Ph.D. and MBAs) Application Development Statisticians (Masters in Statistics) Web Interface Data Managers (MCAs) Tools Development (Masters in Statistics and Computer Science) Information Technology (Engineers and MCAs) Platforms SAS Microsoft Oracle Cognos Business Objects People Capabilities
C-BIA Management • Mayank ShahChartered Accountant Mayank has over 27 years' experience as Consultant in the field of MIS & BI applications. • Ajay SathePGDM, IIM, Ahmedabad Ajay has over 17 years' experience in IT industry specializing in Software Development and Technology Management. • Shrikant Athavale, Industrial Engineer Shrikant has nearly 36 years' experience in Industrial Engineering and Quality Management. • Vanaja Vaidyanathan, MBA and Cost and Works Accountant Vanaja has over eight years of experience in Business Intelligence practice. • Dan Crowell, MSc. in Economics, London School of Economics Dan is our associate based in USA, looking after business development and client interaction.
Experts Panel • Nitin Patel, Ph. D. Dr. Patel is a leading expert on the development of fast and accurate computer algorithms to implement computationally intensive statistical methods. • Suresh Ankolekar, Ph.D. Dr. Ankolekar has over 23 years of academic and consulting experience at Indian Institute of Management,Ahmedabad (IIMA) and Maastricht School of Management, Netherlands (MSM). • Ashok Nag, Ph. D. Dr. Nag, a former senior executive of the Reserve Bank of India, is a well-known expert in the banking and financial analytics, data warehousing and data mining. • Sunil Lakdawala, Ph. D. Dr. Lakdawala has over 20 years' of consulting experience in IT applications for business including Data Warehousing and Data Mining. • V. Chandran, Aeronautical Engineering Chandran has over 22 years' experience in technology functions, including CTO positions in companies with sizeable software teams.
C-BIA Partnerships • SAS: Silver Alliance partner… • Mastek: BI Solutions… • Cytel-Cognizant: Pharmaceuticals- clinical trials… • Statistics.com:XLMiner marketing in USA • Syscon: BI solutions to logistics vertical…
ProfitLogic, US B harat Petroleum, India Mastek, India Dainik Jagran, India Trumac, India TAM Media Research, India Savita Chemicals, Ind ia KPIT Cummins Infosystems Ltd. , India Tata Motors Ltd., India HDFC Standard Life Insurance KR Choksey, India Selected Customers
Our Offering • Business Intelligence Solution • Business Intelligence Platform – End User BI Tool • Data Warehouse • Extract Transform and Load Process • System Administration Processes • Customization and Implementation • Support Service on Annual Contract Basis • Solution on Microsoft or SAS platform
Critical Success Factors for BI • Actionable Information • Summary information to assess performance v/s target and benchmark • Discover low performing and high performing areas • Discover causes of low / high performance • BI Design • Key Performance Indicators (KPI) • OLAP Views • Reports • Leverage technology • Dash Board • Drill-down, Slice and Dice information • Reports – filter / sort information • Deploy analytical techniques – correlation, pareto analysis, trend analysis, distribution analysis
Illustrative Business Processes • Capital Market • Derivatives – Earnings • Derivatives – Risk Management • Equity • Depository • Distribution • IPO’s • NFO’s, Mutual Funds • Life Insurance • Non-Life Insurance • Any other Fixed Income Instruments • Fund and Wealth Management • Portfolio Management • Portfolio Advisory • Knowledge Management – Customer Profiling • Research Distribution • Privilege Customer Services • Customer Call Effectiveness • Business Overview • Financial Performance
Performance Management Issues What is the share of total business of my top few channels? Which are the most popular scrips traded in? Who are my most valued client’s w.r.t trade values? What is the share of total equity business of my top few channels? Who are my most valued client’s w.r.t equity? KPI and Trends Purchase Qty./Amt. Traded Sale Qty./Amt. Traded Purchase Amt. Delivered/Settled Sale Amt. Delivered/Settled Total Trade Amount Dimensions Exchange Scrip Channel Client wise Transaction Type Equity
Key Performance Indicators and Their Performance Trends…Total No. of Trades…
XLDashBoard Demonstration for Actionable Information
Look at All Reports and Views Available Subject-wiseSelect Information from Chosen Subject
Key Performance Indicators and Their Performance Trends…Total No. of Trades…
Study Details….find Performance Levels…Customer Type-wise Average Trade per Transaction…
Drill down ...to Study Low and High Performing Customer Category within Customer Type to Look at Avg. Trade Value
Look at User-friendly GraphsCustomer Type-wise Avg. Trade Value…
Analyse Age Group that Contribute to Trade….Pareto Chart…Age Group-wise Average Trade per Transaction…
Generate Trend Chart of Transactions and Net Brokerage Across Periods...
User-wise Customized Access • Separate logon for each role • Customized portal page • Customized KPIs, Graphs, Views • Access restrictions based on • Role • span-of-control • Level of Information requirement
Technology and Architecture XLDashBoard tools and applications are built on Microsoft platform using tools:
Capability Presentation Workshop Pilot Pilot Assessment Build BI Application: Continuous Improvement Multiple Processes Describe Capability Credentials Give examples of potential benefits Discover Vision Where does the client want to be? What are the client’s information needs? Build a business case Calculate the ROI Present findings to project sponsor Data Source Review including Quality Assessment Project Scoping Time to Information (as-is and to-be) Project Approach
Why XLDashBoard? • Key Benefits • Enterprise wide application providing ‘single version of truth’ • Corporate and Departmental Managers can Analyze their Own Performance…and….save a lot of energy in constructing Excel based Reports and Charts • How delivered • Data stored in dedicated Data Warehouse and Information Cubes • Protected data • No voluminous queries run on transaction systems • Instantaneous response to users with summary information, drill-downs, slice and dice functions • BI delivered on Excel, a most familiar platform • Ability to build ad-hoc reports, new Query and Analysis Views • BI functionality comparable to any world class BI Application…. Plus, statistical analysis and data mining…. • Access control mechanisms • Cost Effective
Why C-BIA • We understand the language of business… • Experts at designing KPIs given business strategy and Critical Success Factors • Right methods for generating actionable information • Experts at Analytics …..show approaches for improving business performance • Leverage technology to its best potential
Thank You Any Questions?