Download
1 / 13
130 likes | 389 Views
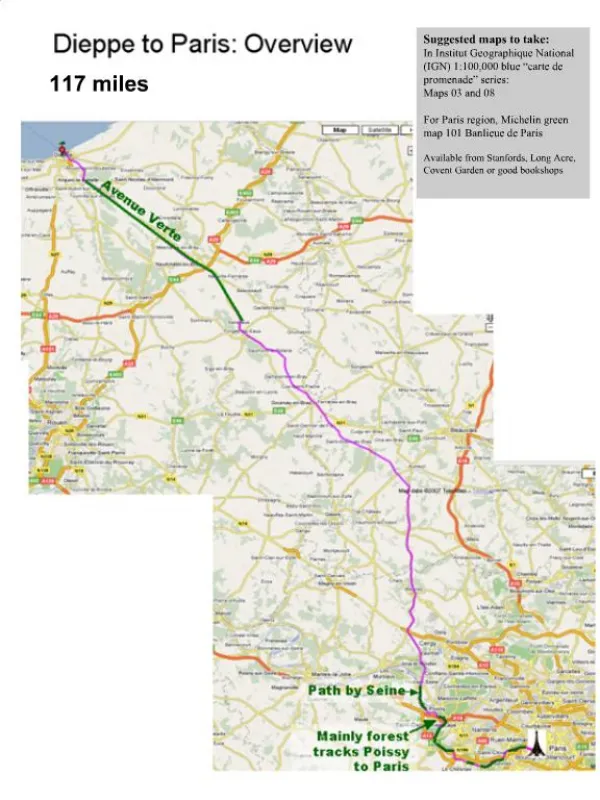
Jamaica Probable Storm Effects. 19 N. Ross Wagenseil for CDMP January 2000. MILES. DEGREES. KILOMETERS. 100. 78.75 W. 1. 75.75 W. 100. 50. 0.5. 50. 25. 10yr. 25yr. 50yr. 100yr. SELECT. Wind. 17 N. CDMP. Wave. Surge. 0. 0. 0.

E N D
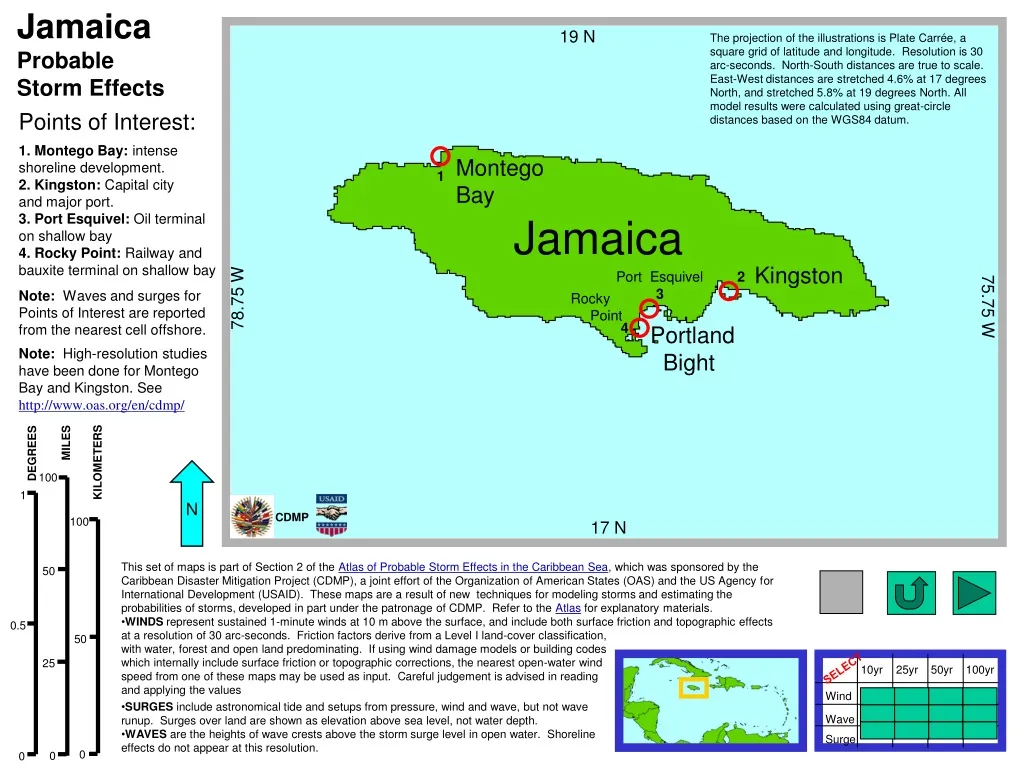
Jamaica Probable Storm Effects 19 N Ross Wagenseil for CDMP January 2000 MILES DEGREES KILOMETERS 100 78.75 W 1 75.75 W 100 50 0.5 50 25 10yr 25yr 50yr 100yr SELECT Wind 17 N CDMP Wave Surge 0 0 0 The projection of the illustrations is Plate Carrée, a square grid of latitude and longitude. Resolution is 30 arc-seconds. North-South distances are true to scale. East-West distances are stretched 4.6% at 17 degrees North, and stretched 5.8% at 19 degrees North. All model results were calculated using great-circle distances based on the WGS84 datum. Points of Interest: 1. Montego Bay: intense shoreline development. Montego Bay 1 2. Kingston: Capital city and major port. 3. Port Esquivel: Oil terminal on shallow bay Jamaica 4. Rocky Point: Railway and bauxite terminal on shallow bay Kingston Port Esquivel 2 3 Note: Waves and surges for Points of Interest are reported from the nearest cell offshore. Rocky Point 4 Portland Bight Note: High-resolution studies have been done for Montego Bay and Kingston. See http://www.oas.org/en/cdmp/ N • This set of maps is part of Section 2 of the Atlas of Probable Storm Effects in the Caribbean Sea, which was sponsored by the Caribbean Disaster Mitigation Project (CDMP), a joint effort of the Organization of American States (OAS) and the US Agency for International Development (USAID). These maps are a result of new techniques for modeling storms and estimating the probabilities of storms, developed in part under the patronage of CDMP. Refer to the Atlas for explanatory materials. • WINDS represent sustained 1-minute winds at 10 m above the surface, and include both surface friction and topographic effects at a resolution of 30 arc-seconds. Friction factors derive from a Level I land-cover classification, • with water, forest and open land predominating. If using wind damage models or building codes • which internally include surface friction or topographic corrections, the nearest open-water wind • speed from one of these maps may be used as input. Careful judgement is advised in reading • and applying the values • SURGES include astronomical tide and setups from pressure, wind and wave, but not wave runup. Surges over land are shown as elevation above sea level, not water depth. • WAVES are the heights of wave crests above the storm surge level in open water. Shoreline effects do not appear at this resolution.
19 N Ross Wagenseil for CDMP January 2000 MILES DEGREES KILOMETERS 100 78.75 W 1 75.75 W 100 50 0.5 50 25 10yr 25yr 50yr 100yr SELECT Wind 17 N CDMP Wave Surge Wind Speeds 0 0 0 0 1 2 3 4 5 Storm Category knots 25 50 75 100 125 mph 25 50 75 100 150 125 kph 50 100 150 200 250 m/s Min 20 60 10 30 40 50 70 Max Winds 10-Year Return Time Jamaica 1 1. Montego Bay: 31 m/s 2. Kingston: 29 m/s 2 3. Port Esquivel: 29 m/s 3 4. Rocky Point: 28 m/s 4 N
19 N Ross Wagenseil for CDMP January 2000 MILES DEGREES KILOMETERS 100 78.75 W 1 75.75 W 100 50 0.5 50 25 10yr 25yr 50yr 100yr SELECT Wind 17 N CDMP WaveHeights Wave Surge 0 0 0 6 4 1 3 5 2 7 Meters 5 10 25 Feet 20 15 Min Max Waves 10-Year Return Time Jamaica 1 1. Montego Bay: 3.8 m 2. Kingston: 3.6 m* 2 3. Port Esquivel: 3.6 m 3 4. Rocky Point: 3.6 m 4 * Input data lacks sufficient detail. N
19 N Surge Heights Ross Wagenseil for CDMP January 2000 1 2 3 4 6 5 Meters 20 15 10 5 Feet MILES DEGREES KILOMETERS 100 78.75 W 1 75.75 W 100 50 0.5 50 25 10yr 25yr 50yr 100yr SELECT Wind 17 N CDMP Wave Surge 0 0 0 Min Max Surges 10-Year Return Time Jamaica 1 1. Montego Bay: 0.4 m 2. Kingston: 0.7 m 2 3. Port Esquivel: 1.6 m 3 4. Rocky Point: 1.1 m 4 N
19 N Ross Wagenseil for CDMP January 2000 MILES DEGREES KILOMETERS 100 78.75 W 1 75.75 W 100 50 0.5 50 25 10yr 25yr 50yr 100yr SELECT Wind 17 N CDMP Wave Surge Wind Speeds 0 0 0 0 1 2 3 4 5 Storm Category knots 25 50 75 100 125 mph 25 50 75 100 150 125 kph 50 100 150 200 250 m/s Min 20 60 10 30 40 50 70 Max Winds 25-Year Return Time Jamaica 1 1. Montego Bay: 41 m/s 2. Kingston: 39 m/s 2 3. Port Esquivel: 39 m/s 3 4. Rocky Point: 38 m/s 4 N
19 N Ross Wagenseil for CDMP January 2000 MILES DEGREES KILOMETERS 100 78.75 W 1 75.75 W 100 50 0.5 50 25 10yr 25yr 50yr 100yr SELECT Wind 17 N CDMP WaveHeights Wave Surge 0 0 0 6 4 1 3 5 2 7 Meters 5 10 25 Feet 20 15 Min Max Waves 25-Year Return Time Jamaica 1 1. Montego Bay: 5.1 m 2. Kingston: 4.7 m* 2 3. Port Esquivel: 4.9 m* 3 4. Rocky Point: 4.8 m* 4 * Possibly invalid:input data lacks detail. N
19 N Surge Heights Ross Wagenseil for CDMP January 2000 1 2 3 4 6 5 Meters 20 15 10 5 Feet MILES DEGREES KILOMETERS 100 78.75 W 1 75.75 W 100 50 0.5 50 25 10yr 25yr 50yr 100yr SELECT Wind 17 N CDMP Wave Surge 0 0 0 Min Max Surges 25-Year Return Time Jamaica 1 1. Montego Bay: 0.7 m 2. Kingston: 1.4 m 2 3. Port Esquivel: 2.8 m 3 4. Rocky Point: 1.9 m 4 N
19 N Ross Wagenseil for CDMP January 2000 MILES DEGREES KILOMETERS 100 78.75 W 1 75.75 W 100 50 0.5 50 25 10yr 25yr 50yr 100yr SELECT Wind 17 N CDMP Wave Surge Wind Speeds 0 0 0 0 1 2 3 4 5 Storm Category knots 25 50 75 100 125 mph 25 50 75 100 150 125 kph 50 100 150 200 250 m/s Min 20 60 10 30 40 50 70 Max Winds 50-Year Return Time Jamaica 1 1. Montego Bay: 49 m/s 2. Kingston: 46 m/s 2 3. Port Esquivel: 46 m/s 3 4. Rocky Point: 45 m/s 4 N
19 N Ross Wagenseil for CDMP January 2000 MILES DEGREES KILOMETERS 100 78.75 W 1 75.75 W 100 50 0.5 50 25 10yr 25yr 50yr 100yr SELECT Wind 17 N CDMP WaveHeights Wave Surge 0 0 0 6 4 1 3 5 2 7 Meters 5 10 25 Feet 20 15 Min Max Waves 50-Year Return Time Jamaica 1 1. Montego Bay: 6.1 m 2. Kingston: 5.1 m* 2 3. Port Esquivel: 5.8 m* 3 4. Rocky Point: 5.7 m* 4 * Possibly invalid:input data lacks detail. N
19 N Surge Heights Ross Wagenseil for CDMP January 2000 1 2 3 4 6 5 Meters 20 15 10 5 Feet MILES DEGREES KILOMETERS 100 78.75 W 1 75.75 W 100 50 0.5 50 25 10yr 25yr 50yr 100yr SELECT Wind 17 N CDMP Wave Surge 0 0 0 Min Max Surges 50-Year Return Time Jamaica 1 1. Montego Bay: 1.0 m 2. Kingston: 1.8 m 2 3. Port Esquivel: 3.9 m nearby, up to 4.2 m onshore to the northeast 3 4 4. Rocky Point: 2.5 m N
19 N Ross Wagenseil for CDMP January 2000 MILES DEGREES KILOMETERS 100 78.75 W 1 75.75 W 100 50 0.5 50 25 10yr 25yr 50yr 100yr SELECT Wind 17 N CDMP Wave Surge Wind Speeds 0 0 0 0 1 2 3 4 5 Storm Category knots 25 50 75 100 125 mph 25 50 75 100 150 125 kph 50 100 150 200 250 m/s Min 20 60 10 30 40 50 70 Max Winds 100-Year Return Time Jamaica 1 1. Montego Bay: 55 m/s 2. Kingston: 53 m/s 2 3. Port Esquivel: 53 m/s 3 4. Rocky Point: 52 m/s 4 N
19 N Ross Wagenseil for CDMP January 2000 MILES DEGREES KILOMETERS 100 78.75 W 1 75.75 W 100 50 0.5 50 25 10yr 25yr 50yr 100yr SELECT Wind 17 N CDMP WaveHeights Wave Surge 0 0 0 6 4 1 3 5 2 7 Meters 5 10 25 Feet 20 15 Min Max Waves 100-Year Return Time Jamaica 1 1. Montego Bay: 6.9 m 2. Kingston: 5.7 m* 2 3. Port Esquivel: 6.6 m* 3 4. Rocky Point: 6.6 m* 4 * Possibly invalid:input data lacks detail. N
19 N Surge Heights Ross Wagenseil for CDMP January 2000 1 2 3 4 6 5 Meters 20 15 10 5 Feet MILES DEGREES KILOMETERS 100 78.75 W 1 75.75 W 100 50 0.5 50 25 10yr 25yr 50yr 100yr SELECT Wind 17 N CDMP Wave Surge 0 0 0 Min Max Surges 100-Year Return Time Jamaica 1 1. Montego Bay: 1.4 m 2. Kingston: 2.4 m 2 3. Port Esquivel: 5.0 m nearby, up to 6.1 m onshore to the northeast. 3 4 4. Rocky Point: 3.3 m N