Download
1 / 26
260 likes | 387 Views
Loran Integrity & Performance Panel (LORIPP). Per Enge, Stanford University, November 2003 Based on the work of: Federal Aviation Administration, U.S. Coast Guard, Peterson Integrated Geopositioning, Booz Allen Hamilton, Ohio University,

E N D
Loran Integrity & Performance Panel (LORIPP) Per Enge, Stanford University, November 2003 Based on the work of: Federal Aviation Administration, U.S. Coast Guard, Peterson Integrated Geopositioning, Booz Allen Hamilton, Ohio University, JJMA, ITT, University of Wales, Reelektronika & Stanford University But the opinions may be mine alone & and the mistakes certainly are!
Integrity Hazards(from Sherman Lo) LORIPP work is organized around these hazards with a system engineering group predicting coverage.
10-7? 10-7 means: • Use the best available engineering to think through the corner cases. • Find the data that describes the hazard. • If the right data does not exist, collect some. • Design monitors to address any real integrity issues. • Remember, over design hurts continuity, availability and coverage.
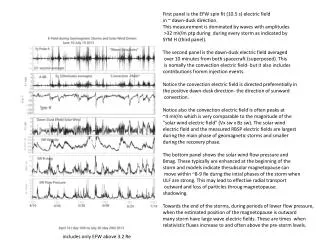
Error Bounds, Not Accuracy Prob(HPE > HPL) < 10-7 per hour • One or more cycle errors: • Envelope TOA at short ranges • Residuals test at long ranges residual of temporal ASF temporal ASF transmitter receiver noise & RFI spatial ASF
Integrity Analysis • is best taught by example. • My favorite example (hazards) are: • evil waveforms for GPS • early skywave for Loran • remember these are only two examples from two long hazard lists.
Differential vertical error up to 8.5 meters SV19 Visibility Period DGPS Position Error Measured by Trimble at the 1993 Oshkosh Air Show Altitude (meters) 19 0 5 10 15 Local time of day
Correlation Peaks C/A PRN Codes Volts Normalized Amplitude 1/fd Chips Code Offset (chips) Modeling Evil Waveforms(from Eric Phelts)
Signal Quality Monitoring(from Eric Phelts) 48 Correlator Receiver Spacings SQM2b 1 0.8 0.6 Normalized Magnitude SQM2b E-L Spacings: 0.1 chips* 0.15 chips 0.2 chips 0.4 0.2 0 -1 -0.8 -0.6 -0.4 -0.2 0 0.2 0.4 0.6 0.8 1 Spacing (chips)
WAAS Safety Processor Safety Processor DO 178 level B WREs, level D CNMP Corrections Processor DO 178, level D Iono. correct. & GIVE Range Domain Position Domain L1/L2 Biases UDRE GIVE + + SV orbit determination & corrections UDRE + + +
Error Bounds, Not Accuracy(from Sherman Lo) LORAN WAAS with Latency Removed
ECD Perturbations at Fairbanks(from Bob Wenzel) time in days UT (n.0 is early afternoon on n-1 in Western Alaska) Large solar proton event on Jan. 10
TD Perturbations at Fairbanks(from Bob Wenzel) 300 nsec time in days UT (n.0 is early afternoon on n-1 in Western Alaska)
Previous plots blown up Caribou (9960W) to Sandy Hook 463NM or 857 km from Bob Wenzel
Early Skywave Cures • Monitor at LorStas and SAMs (not at airports!) • Range limits • Sample earlier (at 20 or 25 microseconds) & maybe speed the rise time of the pulse. • Channel sounding pulse • Receiver autonomous detection See talks by Peter Morris, Bob Wenzel, Frenand Le Roux & Ben Peterson for much more.
Summary 10-7 means: • Use the best available engineering to think through the corner cases. • Find the data that describes the hazard. • If the right data does not exist, collect some. • Design monitors to address any real integrity issues. • Remember, over design hurts continuity, availability and coverage. For Loran • We are well underway. • We have the right people, working the right issues. • But it is a big job
Major Hazards • Temporal Variations of Groundwave including ASF, ECD and SS • Spatial Variations of ASF, ECD & SS • Weather related noise (p-static & atmospheric) • Early skywave • Aircraft dynamics • Man-made RFI • Transmitter Hazards LORIPP work is organized around these hazards with a system engineering group predicting coverage.
Typical Distributions of TOA Measurement(from Ben Peterson) Pcycle error = fn(Envelope uncertainty) Accuracy = fn(Phase uncertainty) Probability Density of TOA Blue - Low SNR, Red - High SNR
Threat Flow from GPS Work • Ground • control • segment • upload • GPS • satellite • nav. message • signal dist. • Airborne • radio • environ. • RFI • multipath Airborne fault detection Airborne rcvr. ionosphere & troposphere Data faults • Ground • radio • environ. • RFI • multipath • Ref. rcvr. • Level D code • cycle slips Fault detection Data broadcast
Monitor Performance nominal prob. density function Pr(false alarm) faulted prob. density function Pr(miss detect)