Download
1 / 31
310 likes | 443 Views
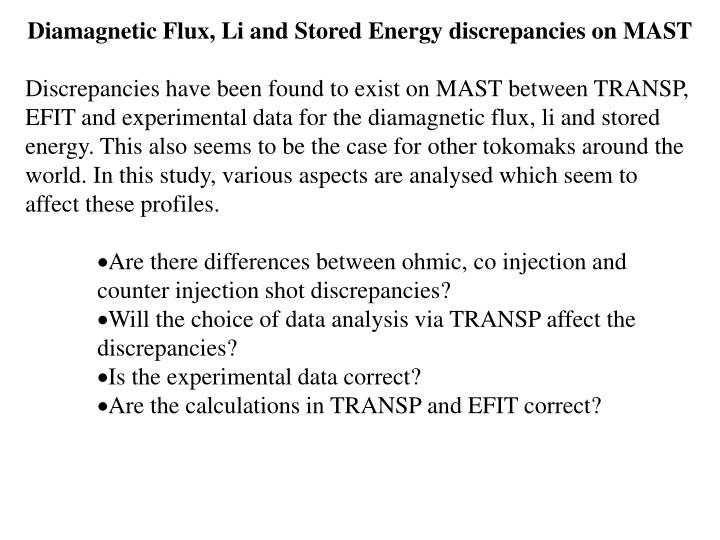
Diamagnetic Flux, Li and Stored Energy discrepancies on MAST

E N D
Diamagnetic Flux, Li and Stored Energy discrepancies on MAST • Discrepancies have been found to exist on MAST between TRANSP, EFIT and experimental data for the diamagnetic flux, li and stored energy. This also seems to be the case for other tokomaks around the world. In this study, various aspects are analysed which seem to affect these profiles. • Are there differences between ohmic, co injection and counter injection shot discrepancies? • Will the choice of data analysis via TRANSP affect the discrepancies? • Is the experimental data correct? • Are the calculations in TRANSP and EFIT correct?
Ohmic, Co Inj and Ctr Inj Shots Diamagnetic Flux Ohmic shots have the best agreement between TRANSP, ttr_dflux, and EFIT, efm_diamag_flux(c), the two sets of data lying to within +/-10% of each other, Fig 1a. Co and ctr injection do not have such a good agreement with the co inj data lying to within +/-30% of each other, Fig 1b, and ctr injection shots to within +/-40%, Fig1c. For ttr_dflux Vs the experimental, amd_dia flux, Fig 2, the ohmic data, Fig 2a show that ttr_dflux is greater and the data lie within 20% of each other. For co inj, ttr_dflux is also greater to within 20%. A third result is produced for the ctr injection shots, Fig 2c, but here, amd_dia flux is greater by 30%, however since there are not enough ctr shots for which amd_dia flux exists, this is inconclusive. For amd_dia flux Vs efm_diamag_flux(c), Fig 3, efm_diamg_flux(c) is greater for each type of shot, by 20% for Ohmic, 20% for Co inj and 10% for ctr inj. Stored Energy TRANSP is consistently higher than EFIT by up to 40%, Fig 4. Li TRANSP is consistently higher than EFIT by up to 90%, Fig 5.
FIGURE 1: TRANSP Vs EFIT DIAMAGNETIC FLUX A) OHMIC - +/- 10% to 0.2s B) CO INJ- +/-30% to 0.2s C) CTR INJ - +/-40% to 0.2s
FIGURE 2: TRANSP Diamagnetic Flux Vs amd_dia flux a) OHMIC +/-20% b) CO INJ +/-30% c) CTR INJ +/-40%
FIGURE 3: amd_dia flux Vs efm_diamag_flux(c) a) OHMIC +/-20% to 0.2s b) CO INJ +/-20% to 0.2s c) CTR INJ +/-10% to 0.2s
FIGURE 4: TRANSP Vs EFIT Stored Energy a) OHMIC +/-40% b) CO INJ +/-40% c) CTR INJ +/-40%
FIGURE 5: TRANSP Vs EFIT LI a) OHMIC +/-90% b) CO INJ +/-90% C) CTR INJ +/-90%
The Effect of Rotation It is interesting to note how much closer the ttr_dflux and efm_diamag_flux(c) is for ohmic shots, Fig 1a. Co and ctr shots have a toroidally rotating plasma; the tangentially injected beams causing the plasma to rotate toroidally. Ohmic shots do not rotate. Does rotation affect the diamagnetic flux? What about li and stored energy? Fig 6a shows ctr shot 8302 with rotation on, Fig 6b with rotation switched off. The effect is to decrease the stored energy by about 10% since there is no longer any rotational energy, and to increase the diamagnetic flux by about 20%. The diamagnetic flux comes closer to EFIT and is slightly larger than amd_dia flux. Fig 6c shows a close up of the lis; li hardly changes. Fig 7a shows co inj shot 7092 with rotation on, Fig 7b with rotation off. Again the stored energy decreases by about 15% when the rotation is turned off, and the absolute value of the diamagnetic flux increases by about 10%. Fig 7c shows that li hardly changes. Ttr_dflux seems to change most for ctr shots when rotation is switched off.
FIGURE6: Ctr Inj shot with and without Rotation b) Ctr inj run 08302N04 - rot off a) Ctr inj run 08302N03 - rot on c) Li’s Compared for 08302N03/N04
FIGURE 7: Co inj Shot with and without Rotation c) Li’s for 07092C02/C01 a) Co inj run 07092C02 - rot on b) Co inj 07092C01 - rot off
The Effect of the Equilibrium Solver • The effect of the equlibrium solver cannot be ignored. Fig 8a shows the correlation between the magnetic axis calculated by TRANSP and the corresponding diamagnetic flux, for run 08493N06, where there were problems with the solver, ESC. There are 3 possible solvers that can be used in TRANSP for STs: • ESC = The Equilibrium and Stability Code (ESC) is a fast, up-down asymmetric MHD toroidal equilibrium code written by L. E. Zakharov (PPPL) solving the Grad-Shafranov equation in flux coordinates. The best option. • RZsolver = Solves the Grad-Shafranov equation in (R,Z) coordinates. • VMEC6 = Variational Moments Equilibrium Code: 2-d code suitable for modelling tokamak geometries of arbitrary moment and adapted to TRANSP. • Figs 8b, c and d show shots 8414, 8563, and 8564 analysed with these different solvers, • Fig8b 8414: ESC(red), RZsolver(green), VMEC6(blue) • RZsolver badly overestimates the absolute value after about 0.2s • ESC and VMEC6 agree quite well with EFIT until about 0.1s after which they underestimate the diamagnetic flux • amd_dia flux was not available
Fig 8c 8563: ESC(old(pink) and updated(green), VMEC6(blue) • the three underestimate efm_diamag_flux(c) and amd_dia flux, until 0.16s after which they overestimate amd_dia flux and underestimate efm_diamag_flux(c). • Fig 8d 8564: ESC (old (yellow) and updated (green)), Rzsolver(blue), VMEC6(pink) • The old ESC and VMEC6 again underestimate amd_dia flux and efm_diamag_flux(c) until 0.14s after which they approach efm_diamag_flux(c) • RZsolver agrees well with amd_dia flux until 0.1s after which it deviates towards efm_diamag_flux(c), crossing it at 0.155s and then becoming even larger • VMEC6 and the old ESC underestimate both and then cross amd_dia flux at 0.13s deviating towards efm_diamag_flux(c) • The new ESC swings above and below amd_dia flux, crossing it at 0.17s and then following the other solver data. • A difference is seen with the solvers, especially with RZsolver, but the quality and accuracy of input data is vital. Figs 8c and 8d show that for the analyses carried out with data of known Ti, the solvers are much closer in their answers. Generally, the ESC solver is then used in the TRANSP analysis and upon a failure to converge, automatically switches to RZsolver.
FIGURE 8: Comparison of Equilibrium Solvers a) Diamagnetic flux and Magnetic Axis for 08493N06 d) Shot 8564 b) Shot 8414 c) Shot 8563
Density and Fast Ion Energy Content Effect • There appears to be a density effect which has an effect on the li profile, pointed out by M. Valovic. High density and low fast ion energy content at the TS time point seem to result in better agreement between ttr_li and efm_li. For example, • Fig 9a shot 6953, run 06953X31, has 7% fast ion energy content and TRANSP li/ EFIT li = 0.99. • Fig 9b shows shot 8246, run 08246C02, where the agreement between the two sets of li data is still good with a fast ion energy content of 16% and TRANSP li/ EFIT li = 1.034. • Fig 9c shows shot 8493, run 08493N08 which has a fast ion energy fraction of 35%, and TRANSP li/ EFIT li = 1.47. The shots are quasi stationary H mode shots. • A more in depth analysis is given, Fig 10a, where TRANSP li/EFIT li at the TS point for selected quasi stationary H mode co inj shots is plotted. • For TRANSP li/EFIT li to within 10% there are: • 43% of shots with fast ion energy content below 10% • 6% of shots with fast ion energy content between 10 and 20% • 11% with f.i. content of 20 to 30% • none in the 30% and over range.
FIGURE 9: Fast Ion Energy Content Effect a) Low Fast Ion Energy -06953X31 b) Medium Fast Ion Energy 08246C02 c) High Fast Ion Energy - 08493N08
Interestingly, for the f.i. group of 10 to 20%, 75% lie above the 30% limit verifying that TRANSP is higher than EFIT for li, and also that efm_li does not vary as much as ttr_li for this group. • The selection of ctr inj shots is smaller and seem to have less of a spread in results, Fig 10b. Again • 43% of shots with f.i. content below 10% are within 10%., compared to • 25% of those with f.i. content between 10 and 20% and • 50% of those between 20 and 30%. • All of the shots with f.i. content above 30% gave results above 30%. • Fig 10c compares ttr_li and efm_li for seven shots. The lower three, 6762, 6953 and 8246 have the closest agreement and have fast ion energies of 9, 7 and 16% respectively, whereas the upper four, 8414, 8416, 8493 and 8498 have 18, 17, 34 and 32% respectively, and the agreement is not so good.
FIGURE 10: Fast Ion energy Content - Li a) Co inj lis at TS b) Ctr inj lis at TS C) Lis for different FI Content
Fig 11 shows the same idea for the diamagnetic flux. • For the ohmic shots: • Fig 11a, 77% of all shots lie to within 10%, there is no f.i. content. • For the co injection shots, Fig 11b: • 100% of shots with f.i. content below 10% lie to within 20%, and • 57% to within 10% of each other. • For the 10 to 20% range, 35% lie within 10%, • 47% to within 20% and 100% to within 30%. • The spread is not so large as for the li data. • Significantly, for the ctr inj shots, Fig 11c, most of all the f.i. content ranges lie in the EFIThalf, showing that efm_diamg_flux(c) is generally greater than ttr_dflux.
FIGURE 11: Fast Ion Energy Content - Diamagnetic Flux a) OHMIC - +/-10%(no f.i) b) Co INJ +/-10% c) CTR INJ +/-10%
Fig 11 (cont) More Ohmic Data e) High Density Ohmic Shot-08995R02 d) Ohmic shots using New ESC - best taken
Variation with H Factor Do the results correlate to the Hh factor in any way? Hh = tau_te_3/ tau_te(ipby2)_3 from tau00**.**. Figs 12a and b show Hh Vs ttr_li/efm_li and Hh Vs ttr_dflux/efm_diamag_flux(c). There are a lack of Hh values available for the data used and so the data pool is not as large as desired. ttr_li/efm_li: Initially it looks like the ctr inj data is closer to 1 but the difference in the mean X values is not large. The difference in mean Y values (Hh) is also not big, but Hh does seem to be slightly larger for the ctr inj shots than for the co inj shots. ttr_dflux/efm_diamag_flux(c): There is a much large difference in the mean X values and the ctr inj shots can definitely be said to have efm_diamag_flux(c) > ttr_dflux, wheras the opposite is true for the co inj shots. The Hh values are as above with the ctr inj shots having larger Hh values.
Figure 12a Figure 12b
Varying the Q Profile used in TRANSP • The choice of q profile as used in TRANSP is important. Figs 13a and 13b show ttr_dflux for runs 6953 and 7051 compared with efm_diamag_flux(c) and amd_dia flux using different choices of q in the TRANSP analyses. • WORST agreement: smoothed EFIT q profile is used all the way through the run without alteration, 6953(rust) and 7051(red) • NEXT WORST: 6953 only, initialising q with EFIT and then evolving q with the PFDE, poloidal field diffusion equation, (green) • MODERATE: The other traces have EFIT q changing to the PFDE at progressively later times, the later the better the agreement • BEST: using EFIT q all the way through apart from near the edge, ie; from r/a=0.75 where it is modified, forcing consistency with the plasma current data, (black). Fig 12b shows the same effect for 7051 (black). • By allowing TRANSP to modify the edge region of the q profile, a better agreement is obtained. • Figs 13c and 13d show ttr_li against efm_li for the same sequence of runs as 13a and 13b. Again it can be seen that the best results are achieved for 06953X31 and 07051X98, (black).
FIGURE 13: Varying the Q Profile EFIT q throughout EFIT q throughout b) Diamagnetic Flux - 7051 a) Diamagnetic Flux - 6953 d) Li - 7051 EFIT q throughout c) Li - 6953 EFIT q throughout
JET Results • JET have observed errors in stored energy, diamagnetic flux and li also. Irina Voitsekovic et al from JET have pointed out that the measured diamagnetic flux, DIFM, and that calculated by EFIT, DIFC, are in good agreement for high density and medium density shots, but DIFC deviates away from DIFM for low density shots. Fig 14a shows shots • 61138, high density : DIFC, DIFM agree, with TRANSP larger • 61079, medium density : DIFC, DIFM agree, with TRANSP larger • and 61132, low density : DIFC, DIFM not in agreement, DIFC closer to TRANSP • Fig 14b shows the same comparison for the lis. The differences are approximately 34, 34, and 24% with respect to TRANSP, so they all disagree quite substantially. Therefore, it can be said that li does not follow the same trend as the diamagnetic flux. However, more data is needed to finalise this.
FIGURE 14: Density Comparison of JET Data a) JET Diamagnetic Flux Comparison b) JET Li Comparison
Figure15: Effect of Argon Seeding (JET data) Li Transp Transp Diamagnetic Flux a) 61371 - with Ar, 59351 - without Ar b) Various Shots with Ar Seeding
Experimental Error Amd_dia flux The main source of error in the AMD_DIA FLUX signal is due to pick-up from the TF and to a lesser extent the Solenoid field; the quoted error of +/-10% includes this.Recently, for shots 10850 onwards, the best signals ever have been recorded. There has been a flat, noise-free TF. This could be due to the fact that JET is not operational at the moment. RM is working to improve matters. Calculations in TRANSP and EFIT Diamagnetic Flux TRANSP:ESC solves the Grad-Shafranov equation in flux coordinates, and . RZsolver (used if no ESC convergence) solves it in (r,z) coordinates and is less likely to have problems with a sharp sepratrix/ or diffuculty to correctly locate the magnetic axis than an inverse solver such as ESC. ttr_dflux is calculated in $CODESYSDIR/source/magcor/mgpout.for.
DO 40 J=LCP1, LEP1 • JM1 = J-1 • ZTF = XI(J,1)**2 * TFLUX (actual flux enclosed) • DFLUX = DFLUX + [(ZTF – ZTPF) * (1.0 –FBZ(JM1,2))/FBZ(JM1,2)] • ZTPF = ZTF • CONTINUE • Where TFLUX is the toroidal flux enclosed in the plasma from the eq solver routine • FBZ is the actual/external toroidal B field at the Zn/bdry (para/diamagnetism) • XI**2 = (PHI/PHILIM) is the relative toroidal flux label • LCP1 - INDEX TO OUTER BDY OF INNERMOST ZONE • LEP1 - INDEX TO PLASMA OUTER BDY • DFLUX is calculated by summing the toroidal flux over all zones and correcting by the factor (1-FBZ)/FBZ . • NB: DFLUX is taken to be TRFLX * (1-FBZ)/FBZ. Is this ok? • TRFLX *(1-FBZ)/FBZ = TFLUX * XI(JB1,1)2 *(1-FBZ)/FBZ • = Btor(int) * XI(JB1,1)2 *(1-Btor(int)/Btor(ext))/Btor(int)/Btor(ext)) • DFLUX = (Btor(ext) – Btor(int)) *dArea
EFIT: solves the Grad-Shafranov in cylindrical RB. EFM_DIAMAG_FLUX(C) is calculated using: cdflux(iges) = cdflux() + (fnow-fbdry)/rgrid(I) *ww(kk)*darea Where iges is a time point fnow is RB at I fbdry is RB is at boundary ww(kk) is the weighting function at grid element kk, 0 outside plasma and 1 inside plasma aarea is the area of the grid rgrid is the position on the grid at I Both ways are valid methods of calculating the diamagnetic flux. Inductance TRANSP: LI02 = 0.5*(total poloidal field energy)/(total plasma vol*local poloidal field energy density/bdy) EFIT: EFM_LI = (B-p)2 dv / (<B-p >2 dv) Where B-p is the poloidal magnetic field and B-p = 0 Iplasma / dl 2*LI02 = EFM_LI
What are the Main Effects? • Diamagnetic Flux and Energy: • rotation, • density, • fast ion energy content, • choice of q profile in analysis, • accuracy of eq solver • Li: • fast ion energy content, • choice of q profile in analysis • accuracy of eq solver • Future: • More counter injection shots are definitely needed to get better statistics and a better feel for what is going on. More high quality co inj shots in the quasi stationary H mode region again to improve statistics. The • Any ideas?