Download
1 / 126
1.3k likes | 1.51k Views
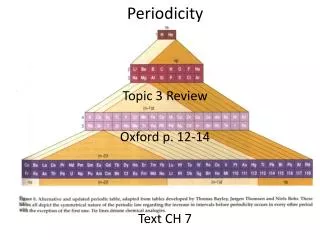
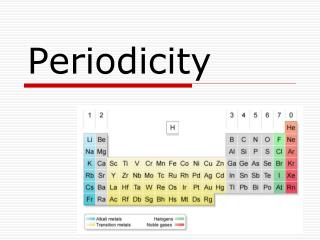
Periodicity. Contents. The Periodic Table Physical Properties Chemical Properties. The Periodic Table. Objectives:. Describe the arrangement of elements in the periodic table in order of increasing atomic number

E N D
Contents • The Periodic Table • Physical Properties • Chemical Properties
Objectives: • Describe the arrangement of elements in the periodic table in order of increasing atomic number • Distinguish between the electron arrangement of elements and their position in the periodic table up to Z = 20 • Apply the relationship between the number of electrons in the highest occupied energy level for an element and it’s position in the periodic table.
Activity • Watch video from Science Bank 3 DVD Disc 2 on; • The Periodic Table • Electronic Structure
Objectives: Describe basic trends in electron arrangement, structure and electrical conductivity in the periodic table. Describe and explain the trends in melting points for the alkali metals (Li → Cs) and the halogens (F→ I) Describe and explain the trends in melting points for elements across period three.
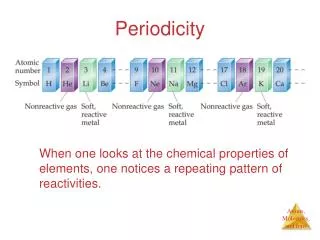
Periodicity and properties • Periodicity is explained by the electron structures of the elements: • Group 1, 2 and 3 are metals, with up to three electrons in their outer shells. They have giant metallic structures. They give away their outer electrons (up to three) to form ionic compounds. • Group 4, with four electrons in their outer shells, are semi-metals. They have giant structures. They only form covalent compounds. • Group 5 to 7 are non-metals with five, six or seven electrons in their outer shells. They either accept electrons (up to three) to form ionic compounds, or share their outer electrons to form covalent compounds. • Group 0 are the noble gases – atoms that have full outer shells and are unreactive.
Metallic Structure • In metallic bonding each metal atom ‘loses’ its outer (valence) electrons. Forming cations surrounded by a ‘sea’ of delocalised electrons. • The greater the number of valence electrons in the metal, the greater the strength of the metallic bond. - - - - - - - - - - - - + + + + + + + 2+ 2+ 2+ 2+ + 2+ 2+ 2+ 2+ - - - - - - - - - - - -
Giant Covalent Structure • Group 4 elements do not form metallic bonds, instead they tend to share electrons to obtain a full outer shell of electrons, this type of bonding is called Covalent bonding. • In Giant Covalent structures the strong covalent bonds occur in all directions making this type of structure particularly strong. • Diamond is a classic example of a giant covalent structure.
Simple covalent structures. • Elements in Groups 5 to 7 form simple covalent molecules. This means that the atoms in each molecule are bonded covalently, these are strong bonds formed from the sharing of electrons. • The molecules are held together by weak forces of attraction. These forces are called van der Waals forces and are produced by the electrons in the molecules. • The bigger the atoms in the molecule or the more atoms in the molecule, the greater the number of electrons and thus the greater the strength of the van der Waals forces and the higher the melting and boiling point of the substance.
Van der Waals • Van der Waals forces are caused by the electrons in a molecule. • As molecules move the electrons get dragged behind them, as they are much lighter than the heavy nucleus. • This means that a temporary imbalance of electrons exists forming a temporary polarity (this means that for a brief moment in time the molecule will have a slightly positive end and a slightly negative end). • This temporary polarity (dipole) causes a brief electrostatic attraction between one molecule and another. This is a Van der Waals force.
Activity; • Analyse the graph from the worksheet ‘Trends in melting points and boiling points of Period 3 Elements’ then describe and explain this trend using your knowledge of bonding.
Simple covalent molecules. There are weak intramolecular forces called ;van der Waals’ between the simple molecules. The strength of the van der waals depends on the size of the molecule. The bigger the molcule the greater the van der Waals. Giant covalent bonding, there are strong covalent bonds in each direction. Metallic bonding, cations in a ‘sea’of delocalised electrons. As the number of outer electrons (valence electrons) increase the strength of the metallic bonding increases. Atomic only there are only very weak forces of attraction between the particles
Comparing Tm and Tb trends down groups 1 and 7 Notice the difference in the trends as we go down each group, can you explain it?
Explaining Tm and Tb trends down groups 1 and 7 decrease • In Group 1 the melting points __________ down the group. • This is because, the atoms get ________ down the group and so the forces of attraction between them become ________. • In Group 7 the melting points show the opposite trend, and _________ down the group. • This is because the solid crystals of the halogens contain non-polar diatomic molecules, which are only attracted to each other by weak forces, the strength of these forces increase with the mass of the molecule (chapter 4 - bonding) bigger stronger increase
Activity • Reread through your notes including page 47- 48 of the Chemistry Course Companion and answer the question from the worksheet; ‘Melting point trends in Groups 1 & 7 & Period 3’ • Find the answers by clicking here.
Electrical conductivity The pattern is good conductivity on the ________ and poor conductivity on the _________. This trend is due to bonding. M_________ bonding on the ______ and c__________ bonding on the _______. Melting point and boiling point There is a clear break in the middle of the table between elements with high melting points (on the ______) and those with low melting points (on the ______). These trends are due to giant ionic lattice structures on the _____ and simple molecular structures on the _______ Trends in physical properties left poor etallic left right ovalent left right left right
Objectives: Describe and explain the trends in atomic radii for the alkali metals and the halogens Describe and explain the trends in atomic radii for elements across period three.
Measuring atomic radii • The atomic radius should be defined as the distance from the centre of the nucleus to the outermost electron. This is not possible, why? • What can be measured, by a technique known as X-ray diffraction, is half the distance between two nuclei of bonded atoms. • If they are bonded covalently it is known as the covalent radius of an atom, whereas if metallic bonding is involved it is the metallic radius.
Atomic properties Some key properties of atoms, such as size and ionisation energy are periodic. Activity: (in pairs) • Look up the atomic radii of the elements on page 7 of the book of data. • Think of a suitable scale and draw scale drawings of the atoms down Group 1 (don’t include Hydrogen or Francium) and along Period 3, using compasses. • Label each atom with its name, symbol and actual radius. • Use a key to show the scaling you have used. • Describe the trend that you can see; down a group and along a period. Can you explain it?
Trends in atomic radii • Atoms get larger as we go down any group. • And get smaller as you go along the period from left to right.
Trends in atomic radii • Atomic radius is a periodic property , it decreases across each period and where there is a jump we start the next period.
Down a group • As we go down group 1 in the periodic table, each element has one extra complete shell of electrons than the one before. • So, for example, the outer electron in potassium is in shell 4, while that in sodium is in shell 3. • Both outer electrons experience the same shielded nuclear charge of 1+. • Shielded nuclear charge refers to the charge from the resultant nuclear charge on the electrons in the outer shell.
Activity: Using your data booklet and your notes fill in the information in the table below. Can you explain the trend in atomic radius along period 3? Na Mg Al Si P S Cl
Activity: Using your data booklet and your notes fill in the information in the table below. Can you explain the trend in atomic radius along period 3? Na Mg Al Si P S Cl
The Shielding effect • The inner shells of electrons shield the outer electrons from the pull of the nucleus. • This doesn’t only affect the atomic radii but also affects reactivity as you will see in the next topic.
Across a period • As we move from sodium to chlorine we are adding protons to the nucleus and electrons to the outer shell – the third shell. • The charge on the nucleus increases from 11+ to 17+ (or +1 to +7 after allowing for shielding of the inner shells, which remains the same). • This increased charge pulls the electrons in closer to the nucleus. • So the size of the atom decreases as we go across a period.
Objectives: Describe and explain the trends in ionic radii for the alkali metals and the halogens Describe and explain the trends in ionic radii for elements across period three.
Ionicproperties Activity: • Look up the ionic radii of the elements on page 7 of the book of data. • Think of a suitable scale and draw scale drawings of the atoms down Group 1 (don’t include Hydrogen or Francium) and along Period 3, using compasses. • Label each atom with its name, symbol and actual radius. • Use a key to show the scaling you have used. • Describe the trend that you can see; down a group and along a period. Can you explain it? • Compare these to the atomic radii. Can you explain the differences?
Trends in ionic properties • Positive ions (cations) vs atoms • When an atom of a Group 1 element loses an electron, the ion that is formed has a much smaller radius – almost half the value. There are two reasons for this. • One fewer electrons than there are protons, so the nucleus attracts the remaining electrons much more strongly. • One fewer energy level, because the outer shell has effectively been removed, and the remaining electrons have the noble gas electron arrangement of the preceding element
Trends in ionic radii down a group • The size of the ions _______ down group 1 as the outer energy level becomes progressively _________ from the nucleus.
How to compare ionic radii along a period • Not all atoms form unipositive ions so we cannot make a direct comparison of ionic radii, but we can compare ions with the same number of electrons these are called iso-electronic ions. • Sodium ions, Na+, magnesium ions, Mg2+, and aluminium ions, Al3+, all contain 10 electrons and have the electron configuration of neon (2,8), with the second shell completely full, these are iso-electronic ions
Trend in ionic radii along the metals in Period 3 • As we move along the metals in period 3 the iso-electronic ions become much smaller. Can you think why? • Sodium has __ protons in the nucleus, magnesium has __ and aluminium __. The __ protons in the aluminium nucleus will attract the eight electrons in its outer shell ____ than the __ protons in the nucleus of the sodium ion.
Trends in ionic properties • Negative ions (anions) • When the atoms of elements in group 7 gain one electron to form a negative ion, there will be one more electron in the outer shell and hence more electron-electron repulsion. • The number of protons in the nucleus is unchanged, each of the electrons will be attracted less strongly, and the radius of the ion increases to almost twice the radius of the atom.
Trends in ionic radii down a group • The size of the ions _______ down group 7 as the outer energy level becomes progressively _________ from the nucleus.
Trend in ionic radii along the non-metals in Period 3 • As we move from metals to non-metals in Period 3 the iso-electronic ions become much _______, but from right to left they get __________. Can you think why? • Compare the electron arrangements and protons of silicon and phosphorus.
Trend in ionic radii along the metals in Period 3 • Silicon has ___ protons and ____ electrons, phosphorus has ___protons and ___ electrons. Silicon has the electron arrangement _____ and phosphorus has the arrangement ______. There will be a greater pull on the outer electrons in __________ which makes the ion much _________. • Phosphorus has __ protons in the nucleus, sulphur has __ and chlorine __. The __ protons in the chlorine nucleus will attract the eight electrons in its outer shell ____ than the __ protons in the nucleus of the phosphorus ion.
Objectives: Define the terms first ionisation energy. Describe and explain the trends in first ionisation energies for the alkali metals and the halogens Describe and explain the trends in first ionisation energies for elements across period three.
Ionisation Energies • A graph of the first ionisation energies of the elements against atomic number illustrates periodicity very clearly. • Can you state the definition for the first ionisation energy of an element, can you write an equation to show this? The first ionisation energy of an element is the energy required to remove one mole of electrons from one mole of atoms of the element in the gaseousstate. M(g)→ M+(g) + e- It is measured in Kilojoules per mole – kJ mol-1
Trends in first ionisation energies • Activity: • Look at your graph of first ionisation energies. • Describe (state) the trend in first ionisation energies down groups 1 and 7 and across period 3. • Using your knowledge of nuclear charge, shells, pull of nucleus, electron arrangement try and explain the trend in first ionisation energies down groups 1 and 7 and across period 3.
further highest less increase decrease nearer lowest harder more easier Explanation of trend down a group • The elements in group 1 have the _______ values in each period and the noble gases have the ________values. • As we go down group 1 the values _______, because the outer electron is ________ from the nucleus and is therefore already in a higher energy level, so ____ energy is required to remove it. • This is the same for all groups.