Download
1 / 35
350 likes | 463 Views
SOUTHERN CALIFORNIA COASTAL WATER RESEARCH PROJECT (SCCWRP). Stephen B. Weisberg Executive Director. WHAT IS SCCWRP?. Joint Powers Agency founded in 1969 Initiated to address regional monitoring and research needs -- Cumulative impact assessment -- Methods development -- Data Integration

E N D
SOUTHERN CALIFORNIA COASTAL WATER RESEARCH PROJECT(SCCWRP) Stephen B. WeisbergExecutive Director
WHAT IS SCCWRP? • Joint Powers Agency founded in 1969 • Initiated to address regional monitoring and research needs -- Cumulative impact assessment -- Methods development -- Data Integration • Member organizations include city, county, state, and federal agencies -- Unique combination of regulators and regulated
MEMBER ORGANIZATIONS City of San Diego City of Los Angeles Orange County Sanitation District Los Angeles County Sanitation Districts San Diego Regional Water Quality Board Santa Ana Regional Water Quality Board Los Angeles Regional Water Quality Board State Water Quality Board U.S Environmental Protection Agency
SCCWRP’S GOALS • To develop, participate in, and coordinate programs to understand ecological systems in the coastal waters and to document relationships between these systems and human activities; • To answer the questions regarding the southern California coastal waters: (a) Is it safe to swim? (b) Is it safe to eat the fish? (c) Is the ecosystem healthy? (d) Are the natural resources being protected? • To effectively communicate our research findings and recommendations, through a variety of media to decision makers and other stakeholders; • To serve as a catalyst in forming partnerships and alliances which further these goals; and • To provide an information management system to archive, retrieve, analyze, and display SCCWRP data in order to achieve the above goals and enhance our understanding of the Southern California Bight.
SOME FOCAL POINTS OF CURRENT SCCWRP RESEARCH • Source estimation • Regional monitoring • Stomwater assessment • TMDL development
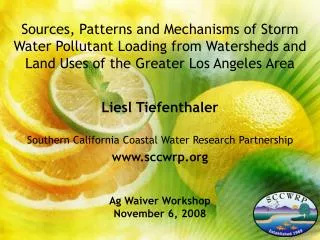
WHY STUDY MASS EMISSIONS? • Relative risk among sources -- Where do the largest proportion of pollutants come from?? • Changes over time -- Were management actions effective at reducing loads?
TYPES OF SOURCESYEAR OF LAST ESTIMATE Publicly Owned Treatment Works (POTW) ongoing Power generating stations 1995 Industrial dischargers 1995 Hazardous material spills 1989 Urban runoff ongoing Dredged material disposal/ocean dumping 1997 Oil platforms 1996 Atmospheric deposition ongoing Vessel bottom points an anodes ongoing Oceanic currents 1973
Population 10 1000 Wastewater Flow LA River Population (millions) Annual Discharge Volume (billion liters) 1 100 0.1 10 1900 1920 1940 1960 1980 2000 Year
350 2400 300 2200 250 2000 200 Suspended Solids (thousands metric tons) Wastewater Volume (billion liters) 150 1800 Wastewater Flow 100 Suspended Solids 1600 50 1970 1975 1980 1985 1990 1995 Year
800 Chromium Copper 600 (metric tons) 400 Mass Emissions 200 0 1970 1975 1980 1985 1990 1995 Year
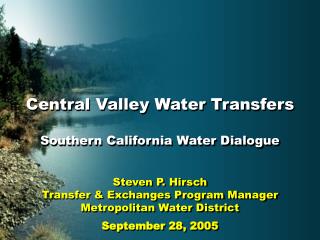
100 1971 - 1972 80 Urban Runoff 60 POTW Wastewater 40 20 Percent Contribution to Ocean 0 100 1994 - 1995 80 60 40 20 0 Zinc Flow Lead Nickel Copper Suspended Solids Ammonia Chromium Phosphorous
SANTA ANA RIVER PROJECT • Collected water samples every 15 minutes for an entire year -- Automated sampler • Almost 2000 samples -- Measured TSS on all -- Measured metals/organics on approximately 200 • Several project goals -- Accurately estimate mass emission for the year -- Compare our estimate from intensive sampling with that of routine sampling frequencies -- Use simulation approach to identify optimal subsampling strategy
REGIONAL MONITORING • Nearly $20M/year is spent on routine marine monitoring in southern California -- >80% is associated with discharge permits • Despite this expenditure we can’t provide a regional assessment of condition • Most monitoring is site-specific -- Less than 5% of the southern California coast is monitored • Existing data can’t be easily integrated -- Different parameters -- Different methods -- Inaccessible data
WHAT ARE WE DOING TO ADDRESS THE PROBLEM? • Two cooperative regional monitoring surveys -- $3M effort in 1994 involved 12 organizations -- $8M effort in 1998 involving 62 organizations • Unique funding mechanism -- Regulators modified permits reallocating sampling effort towards regional monitoring -- Helps keep costs nearly neutral for participants • Dischargers work jointly with regulators to define most appropriate methodologies -- Pooling of expertise -- Increase in communication
SANTA MONICA BAY SEDIMENT(Final Round) Component LAB-1 LAB-2 LAB-3 LAB-4 LAB-5 LAB-6 Naphthalene 213 162 170 191 139 193 2-Methylnapthalene 376 435 480 532 405 525 Biphenyl 659 644 850 800 606 796 2,6-Dimethylnaphthalene 403 212 255 343 228 269 Fluorene 33 25 50 40 24 53 Phenanthrene 116 131 145 130 109 141 1-Methylphenanthrene 16 62 27 68 51 128 Fluoranthene 152 280 150 135 87 183 Pyrene 227 196 155 230 79 185 Benz[a]anthracene 91 126 145 118 65 114 Chrysene 113 88 121 152 83 145 Benzo[e]pyrene 129 115 155 183 171 115 benzo[a]pyrene 125 109 195 191 162 66 Perylene 62 91 79 110 72 26 benzo[g,h,I]perylene 30 100 nd nd 109 97 TOTAL 3,279 3,280 3,653 3,927 2,957 3,515
SANTA MONICA BAY SEDIMENT(First Round) Component LAB-1 LAB-2 LAB-3 LAB-4 LAB-5 LAB-6 LAB-7 LAB-8 LAB-9 Naphthalene 54 171 279 27 139 259 54 211 87 2-Methylnapthalene 129 485 721 59 405 615 193 653 270 Biphenyl 233 756 1,140 97 606 770 297 650 437 2,6-Dimethylnaphthalene 131 217 401 37 228 203 94 356 138 Fluorene 0 38 75 2 24 69 nd 26 19 Phenanthrene 0 137 469 9 109 112 69 95 90 1-Methylphenanthrene 0 154 0 0 51 nd nd 31 52 Fluoranthene 76 0 495 26 87 108 187 173 149 Pyrene 91 0 1,120 28 79 111 153 165 158 Benz[a]anthracene 0 0 284 30 65 38 140 100 122 Chrysene 60 0 320 31 83 46 167 136 151 Benzo[e]pyrene 0 0 367 11 171 63 117 195 138 benzo[a]pyrene 0 0 409 13 162 nd 163 189 139 Perylene 0 249 183 5 72 32 81 59 83 benzo[g,h,I]perylene 0 0 60 0 109 30 160 163 nd TOTAL 834 2,418 7,657 451 2,957 2,836 2,294 4,034 2,493
STORMWATER ASSESSMENT • Where does the plume go? • Is it toxic? -- Seasonal patterns • What are the causes of toxicity -- Toxicity identification evaluation
DISSOLVED METALS Median Effective Concentration Ballona Creek (ug/L) (ug/L) Cd 1200 nd-1 CU 31 3 – 28 Zn 22 36 – 183 Mn >40,000 1 – 114 Pb nd – 16 Ni 1 - 5
Plume Dispersion Study Current Dilution Decay Flow Bacterial Concentration Beach Storm Drain
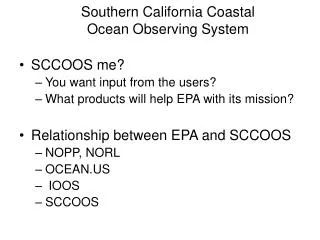
SOMESCIENTIFIC ASPECTS OFTMDL DEVELOPMENT • Problem definition • Source identification • Model development • -- Hydrodynamic component • -- Rate processes
Slow Stream, Fast Degradation Fast Stream, Slow Degradation Source 1 100,000 MPN/100mL FLOW FLOW Source 1 100,000 MPN/100mL 95,000 10,000 90,000 5,000 85,000 1,000 Source 2 1,000 MPN/100mL Source 2 1,000 MPN/100mL 80,000 995 200 900
BACTERIAL DEGRADATION STUDY • Six day study -- Every six hours the first day • Three bacteria plus virus • Several potential factors -- Type of inocculant (sewage, stormwater) -- Temperature -- UV radiation -- Suspended solids -- Nutrient concentration