Download
1 / 48
480 likes | 589 Views
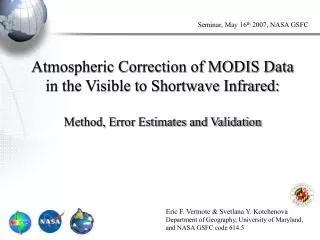
ARESE II: Description and Initial Results (ARM Enhanced Shortwave Experiment). Robert G. Ellingson and the ARESE II Science Team Department of Meteorology University of Maryland College Park, MD. Motivation.

E N D
ARESE II: Description and Initial Results (ARM Enhanced Shortwave Experiment) Robert G. Ellingson and the ARESE II Science Team Department of Meteorology University of Maryland College Park, MD
Motivation • Knowledge of the amount and location of solar energy absorption is key to understanding the general circulation of the ocean and atmosphere and to our understanding and prediction of climate change. • Measurements of the amount of solar radiation absorbed within clouds have yielded conflicting results. Manystudies show much more absorptionthan can be explained by theory. • If excess or enhanced absorption is true - we must: • reexamine our knowledge of the basic physics • modify climate models, AND • change remote sensing techniques.
The ARESE Experiments - Objectives • Directly measure the absorption of solar radiation by the clear and cloudy atmosphere and • investigate the causes of any absorption in excess of model predictions. ARESE I - 25 September - 1 November 1995 ARESE II - 15 February - 15 April 2000
ARESE I - A Thumbnail Sketch • Used three aircraft platforms, as well as satellites and the ARM central and extended facilities in North Central Oklahoma • Measured solar radiative fluxes at different altitudes and at the surface with spectral broadband, partial bandpass, and narrow bandpass filters • Measurements obtained from aircraft flying in stacked formation over horizontal legs extending over several hundred kilometers 25 September - 1 November 1995
ARESE I - broadband absorptance increases with cloud fraction Courtesy of R. Cess - SUNY Stonybrook
ARESE-II Conducted During Feb -Apr ‘00 • Major Features • Unique sampling strategy - single aircraft overflying SGP CART site on only overcast days • Multiple independent instruments making same measurements with different technologies (aircraft and ground) • Extensive pre- and post- experiment calibrations • Long duration during a period of climatologically high frequency of extensive overcast (~ 6 cases) • Science Team with considerably different pre-experiment views Simulation by A. Marshak ARESE-II was coordinated with an ARM Cloud IOP - insitu measurements of cloud microphysics
The ARESE-II Measurement Strategy Differed Significantly From ARESE-I Ingress • Used single aircraft (Twin Otter) repeatedly overflying surface instruments • Single aircraft reduced cost, makes long deployment possible • ARESE-I showed thick stratus approach uniform case • 2 years CART data ~ 4-6 uniform stratus cases in 6-week period • Consistent with simulations by R. Cess and by A. Marshak Central facility Blue=data flight leg Red=data not valid Continue on One of 2 flight patterns (6 min revisit, 83% duty cycle)
DHC-6 Twin-Otter Photos courtesy of Tim Tooman
Conditional Sampling (theory) from Marshak et al., 1999: On the Removal of the Effect of Horizontal Fluxes in Two-Aircraft Measurements of Cloud Absorption. Quart. J. Roy. Meteor. Soc., 558, 2153-2170. Courtesy of Alexander Marshak
Extensive Spectral and Broadband Calibrations Were Performed Before and After ARESE II • Spectral calibrations at Ponca City airport using lamps traceable to the ARM working standard • Broadband calibrations at Blackwell-Tonkawa airport • Broadband calibrations at SGP site • Surface measurements at SGP 19 February through 6 April 2000
ARESE II Broadband Calibration Facility at Blackwell-Tonkawa Airport Photos courtesy of Joe Michalsky PNNL/SUNY
Direct Measurement Uncertainty 3 W/m2 Diffuse Measurement Uncertainty 5 W/m2 But ... Slide courtesy of Joe Michalsky PNNL/SUNY
The Twin Otter Payload Was Significantly Enhanced Over ARESE I 3 sets of spectral and broadband nadir and zenith viewing radiometers Scripps, RAMS total solar broadband hemispheric (224-3910 nm)Valero Scripps, RAMS fractional solar broadband hemispheric (680-3300 nm) Scripps, RAMS total direct-diffuse hemispheric; seven bands(495-505; 400-450; 450-500; 500-550; 550-600; 600-650; 650-700 nm) NASA ARC SSFR (300-2500 nm in ~300 channels)Pilewskie CSU SSP2 (400-2500 nm in ~100 channels)Stephens MRI, CM21 broadband hemispheric (3350-2200 nm)Asano SNL, CM22 broadband hemispheric (3350-2200 nm)Tooman Cloud and meteorological measurements JPL/UMASS ACR nadir viewing radar Sekelsky BNL total temperature Tooman BNL static pressure BNL chilled mirror hygrometer
ARESE II Summary • High quality data obtained on several clear and overcast days (03/03, 03/17, 03/18, 03/21, 03/29 {best ones}) • b1 data released by instrument PIs to ARESE II Science Team in Sept 2000 (some data in better state than others) • ARESE II ST data discussion meeting 24-26 Oct 2000 • Reprocessing with common calibration Nov-Dec 2000 • ARESE II ST meeting 8-9 Feb 2001 - preliminary findings • Data released to science community 17 March 2001 • Publication of ARESE II Science Team papers in progress For additional information see the ARM UAV Homepage http://armuav.atmos.colostate.edu/
Looking for the Right StuffMarch 29, 2000 - An Excellent Example
CART MMCR Reflectivty Flight Track Latitude (°N) Altitude (km AGL) (°E ) Otter Cloud Radar 5 Altitude (km MSL) 3 0 1800 1900 2000 Time (UTC) What Did We See From the Aircraft and Ground?
1600 1400 1200 1000 800 600 400 18.5 19.5 20.5 SSFR Upwelling Fluxes - 03/29/00 Wavelength (nm) Time (hours)
Nadir irradiance Irradiance (W m-2 nm-1) Albedo Albedo 400 600 800 1000 1200 1400 1600 Wavelength (nm) Preliminary SSFR Data From 29 March 2000 1930 UTC Data courtesy of Peter Pilewskie, NASA Ames
Absorptance Defined as the layer absorption divided by the downwelling solar flux at the top of layer (aircraft level) Slide courtesy of Tom Ackerman
14 BB absorption Histogram 12 March 29, 2000 10 8 frequency 6 4 2 0 0.205 0.21 0.215 0.22 0.225 0.23 0.235 0.24 0.245 BB absorption Conditional Sampling(March 29) Courtesy of Alexander Marshak
These data are from the five days for which absorptance measurements from the CM22 radiometers and the TSBR radiometers can be compared. There are two clear days, 0227 and 0320, with low absorptance values, and three cloudy days with higher absorptances. Agreement between the two types of radiometers is very good. (A 3% difference in the upwelling at 7 km on 0303 accounts for the offset in absorptance on that day.) Conclusion: The two different types of radiometers yield the same measured absorptance in both clear and cloudy conditions. Results courtesy of Pope et al.
Preliminary Comparisons of Model Calculations with Observations
Bars represent leg to leg variability Results courtesy of Ackerman et al.
Ignore CM21 results shown here Results courtesy of Ackerman et al.
Day averages of absorptance (from TSBR measurements) show values of 0.10 to 0.12 for the clear days and values of 0.20 to 0.23 for the cloudy days. A standard model gives absorptance values ranging from 0.10 for clear sky to 0.15 for cloudy sky (optical depth 60). Conclusion: observed cloudy-sky absorptances are significantly greater than model predictions. Results courtesy of Pope et al.
O’Hirok and Gautier, 2001 TOMS BBSS MWR BLC MMCR MPL RAMS SMOS CM21/22s AOS MFRSR MFR TDDR SSP SB3D SSFR MIE SBMOD aerosol atm. surface cloud SHORTWAVE ABSORPTION COMPARISON model obs. obs.
03/29/2000 9 structure km 0 120 = 55 re = 7.5 optical thickness 60 0 within 2.5 km of cart site 17:30 21:30 UTC 0 75 km O’Hirok and Gautier, 2001
March 03 2000 0.5 Model Absorptance RAMS Cm22 0.4 0.3 +/-10% 0.2 +/-5% 0.1 0.0 visible near-ir total O’Hirok and Gautier, 2001
March 21 2000 0.5 Model Absorptance RAMS Cm22 0.4 +/-10% +/-5% 0.3 0.2 0.1 0.0 near-ir visible total O’Hirok and Gautier, 2001
March 29 2000 0.5 Model Absorptance RAMS Cm22 0.4 +/-10% +/-5% 0.3 0.2 0.1 0.0 visible near-ir total O’Hirok and Gautier, 2001
March 29 2000 model sensitivity 0.06 RAMS visible absorptance Cm22 0.03 0.4 near-ir absorptance 0.3 0.25 total absorptance 0.15 ref rnd ipa re x2 drz ice x4 O’Hirok and Gautier, 2001
Summary conclusions to date • Ackerman et al. - Differences between modeled and observed absorption on cloudy days are order 10% • Pope et al. - observed cloudy-sky absorptances are significantly greater than model predictions. • O’Hirok and Gautier - major differences between observations and calculations are in the near IR, but total differences are within the order 10% range. • Common to all • Observed absorption is greater than calculated • Smaller absorption and smaller discrepancies than ARESE I
Problemsand Paths Forward • Apparent disagreement between different models - use ICRCCM as an arbiter • Causes of the discrepancies not yet identified - expanded use of the spectral data and extensive examination of all the data by the ARM Science Team and the general science community • The data are there - Have at them!!!
ARESE-II has a broad-based Science Team Ackerman, Tom (PNNL) Marshak, Sasha (Univ Maryland) Asano, Shoji (Tohoku Univ) Michalsky, Joe (SUNY Albany) Cahalan, Bob (NASA GSFC) Minnis, Pat (NASA LRC) Cess, Bob (SUNY, Stony Brook) Sekelsky Steve (Univ Mass) Ellingson, Bob* (Univ Maryland) Stephens, Graeme (CSU) Gautier, Catherine (UCSB) Tooman, Tim (SNL) Long, Chuck (PSU) Valero, Francisco (Scripps) Mace, Jay (Univ Utah) Vitko, John (SNL) Marchand, Roger (PNNL) Wiscombe, Warren (NASA GSFC) * Mission Scientist
Pre- and Post- ARESE II Boadband Calibrations Data Pre- Post- courtesy of Joe Michalsky PNNL/SUNY Post- Pre-