Download
1 / 34
360 likes | 557 Views
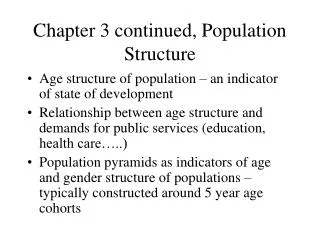
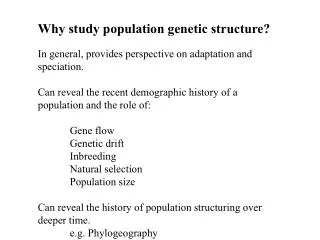
Population Structure. Partitioning of Genetic Variation. Banner-tailed kangaroo rat ( Dipodomys spectabilis ). Distribution of populations. SSW. 1 km. R2. Distribution of populations. 1 km. Distribution of populations. 1 km. Distribution of populations. 1 km.

E N D
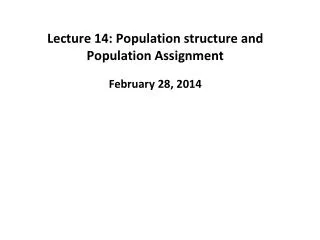
Population Structure Partitioning of Genetic Variation
Distribution of populations SSW 1 km R2
Hierarchical Population Structure Partitioning of the genetic variation between the different groupings of individuals Hierarchical levels Total population Subpopulation Breeding groups Individuals Population Structure
Distribution of populations Are the two populations in HaWeE? We trap animals in the box and catch approximately equal numbers of animals from the two population. Is the population now in HaWeE? No, deficient in heterozygotes! Population subdivision results in fewer heterozygotes than we would expect if only 1 population pA=1.0 pa=1.0
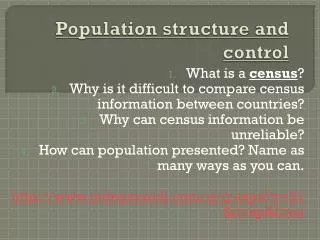
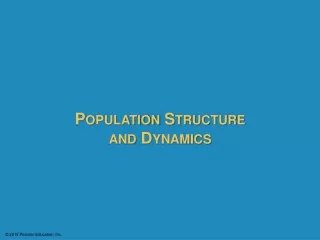
North Beaufort Sea South Beaufort Sea Davis Strait Western Hudson Bay
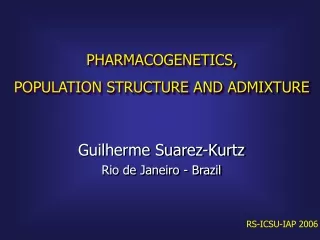
North Beaufort Sea Western Population South Beaufort Sea Eastern Population Davis Strait Western Hudson Bay
North Beaufort Sea South Beaufort Sea Total Population Davis Strait Western Hudson Bay
Heterozygosity within Populations • Calculate H at each hierarchical level • Populations • Hlocus = (1-(∑pi2)) • HS = (I=1∑n Hlocus)/n • n = Number of loci
Heterozygosity within Regions • Calculate H at each hierarchical level • Regions • Estimate average allele frequency within each region • Hlocus = 1-( j=1∑a(I=1∑Rpi/R)2 • R = # regions • a = # alleles • HR = (I=1∑n Hlocus)/n • n = Number of loci • Weight this value by the number of populations in each region.
Heterozygosity Total • Calculate H at each hierarchical level • Total • Estimate average allele frequency within each region • Hlocus = 1-( j=1∑a(I=1∑SPpi/SP)2 • SP = # subpopulations • a = # alleles • HT = (I=1∑n Hlocus)/n • n = Number of loci
Who Cares?? • Study of statistical differences among local populations is an important line of attack on the evolutionary problem. While such differences can only rarely represent first steps toward speciation in the sense of the splitting of the species, they are important for the evolution of the species as a whole. They provide a possible basis for intergroup selection of genetic systems, a process that provides a more effective mechanism for adaptive advance of the species as a whole than does the mass selection which is all that can occur under panmixia. Sewall Wright.
Translation • Population subdivision reduces population size. • Reduced population size increases genetic drift which decreases genetic diversity or increases inbreeding • Different populations will then diverge from each other with the possibility of speciation
Inbreeding Animals prefer to mate with individuals more closely related to them than a random individual Decreases heterozygosity Reduces genetic variation Sexual Selection Inbreeding Animals mate at random but there are a limited number of mates from which to choose due to population subdivision. Decreases heterozygosity Reduces genetic variation Genetic Drift Inbreeding
Wright’s F-stats • Fixation Index (F) • Quantifies inbreeding due to population structure • Reduction in H due to structure • Estimates the reduction in H expected at one level of the hierarchy relative to another more inclusive level. • FSR - Decrease in H given that the regions are divided into subpopulations • FST - Decrease in H given the that the whole system is not panmictic. • FST = ? in panmictic population? • FST = ? in completely isolated populations?
Of the total genetic variation found in the 4 major polar bear populations only 7% is due to the subdivision of the population.
Interpreting F-stats • FST = 0 - 0.05 • Little genetic differentiation • FST = 0.05 - 0.15 • Moderate genetic differentiation • FST = 0.15 - 0.25 • Great genetic differentiation • FST = > 0.25 • Very great differentiation
Interpreting F-stats • Recall • F=1/(1+4Nm) • Nm={(1/F)-1}*0.25 • If F = 0.15 • Nm = {(1/0.15)-1}*0.25 • Nm = (6.67-1)*0.25 • Nm = 1.4 • One migrant per generation will prevent great genetic differentiation or fixation of different alleles • FST = 0 - 0.05 • Little genetic diff. • FST = 0.05 - 0.15 • Moderate genetic diff. • FST = 0.15 - 0.25 • Great genetic diff. • FST = > 0.25 • Very great diff.
Isolation BreakingThe Wahlund Principle • If Population subdivision leads to a reduction in the number of expected heterozygotes it must also result in a greater number of homozygotes than expected. • When isolation is broken homozygosity decreases
Isolation BreakingThe Wahlund Principle pA= 0.5 pa=0.5 pA=1.0 pa=1.0 aa = 0.25 Aa = 0.5 AA = 0.25 aa = 0.5 Aa = 0.0 AA = 0.5
Isolation BreakingThe Wahlund Principle pA= 1.0 pa=1.0 pA=1.0 pa=1.0 P(a) = q1 P(aa) = q12 P(a) = q1 P(aa) = q12 P(a) = q1 + q2 P(aa) = {(q1 + q2)/2}2 ={(1.0 + 0.0)/2}2 =0.25 Average = (q12 + q22)/2 (12 + 02)/2 = 0.5 Frequency of homozygotes decreases after fusion
Isolation BreakingThe Wahlund Principle aa = 0.5 pA= 1.0 pa=1.0 pA=1.0 pa=1.0 aa = 0.5 => 0.25 Fusing separated populations reduces the average frequency of each homozygote by an amount equal to the variance in allele frequency among the original populations following random mating. Var(q) = 0.5(q1 - qavg)2 + 0.5(q2 - qavg)2 = 0.5(1.0 - 0.5)2 + 0.5(0 - 0.5)2 = 0.5*0.25 + 0.5*0.25 = 0.25
The reduction in homozygosity due to fusion 2* 2 (assumes 2 alleles what would it be with more alleles??) This must equal the increase in heterozygosity HT - HS of FST = (HT-HS)/HT FST = (2*2)/HT HT = 2pq FST = 2 / 2pq Thus the F-stats at each of the hierarchical levels are related to the variances of the allele frequencies grouped at the levels of interest. Given this we can calculate the average genotype frequencies across populations…. F and Wahlund
In subdivided populations it is possible to calculate the average genotype frequencies across all populations The genotypes across the subpopulations don’t obey HaWeE Excess homozygotes The genotypes within the subpopulations do obey HaWeE. Genotypes in Subdivided populations Remember, FST = 2 / 2pq and FST is the reduction in heterozygosity due to subdivision
Selective mating between close relatives The effect of inbreeding is to reduce the heterozygosity of a population Defined as, “F - The proportionate reduction in heterozygosity relative to random mating”. Analagous to our population subdivision but it is within a subpopulation F = (HO - HI)/HO HO = 2pq Why? HI = HO-HOF =HO(1-F) =2pq(1-F) The other Inbreeding
In inbreed populations it is possible to calculate the expected genotype frequencies in an analagous fashion to subdivision The genotypes don’t obey HaWeE Deficiency of heterozygotes = 2pqF These are allocated equally amongst the two homozygotes because each heterozygote as an “A” and an “a” Inbreeding Remember, Fis the reduction in heterozygosity due to inbreeding