1 / 0

Ecological Footprint Definitions, Calculations Methodology and Assessments

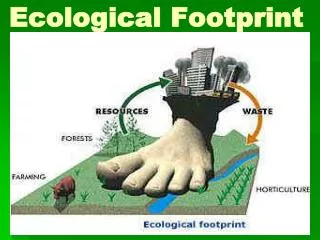
Ecological Footprint Definitions, Calculations Methodology and Assessments. Prepared and Compiled By Dr. Safwat H. Shakir Hanna From Different References. What is Ecological Footprint- It’s Importance .

collin
Download Presentation

Ecological Footprint Definitions, Calculations Methodology and Assessments

An Image/Link below is provided (as is) to download presentation Download Policy: Content on the Website is provided to you AS IS for your information and personal use and may not be sold / licensed / shared on other websites without getting consent from its author. Content is provided to you AS IS for your information and personal use only. Download presentation by click this link. While downloading, if for some reason you are not able to download a presentation, the publisher may have deleted the file from their server. During download, if you can't get a presentation, the file might be deleted by the publisher.

E N D

Presentation Transcript


  1. Ecological FootprintDefinitions, Calculations Methodology and Assessments

    Prepared and Compiled By Dr. Safwat H. Shakir Hanna From Different References
  2. What is Ecological Footprint- It’s Importance The Ecological Footprint has emerged as the world’s premier measure of humanity’s demand on nature. This accounting system tracks, on the demand side (Footprint), how much land and water area a human population uses to provide all it takes from nature.
  3. What is Ecological Footprint- It’s Importance The Ecological Footprint is a potential tool to: jointly measure planetary boundaries and the extent to which humanity is exceeding them. It can be used to investigate issues such as the limits of resource consumption, the international distribution of the world’s natural resources,
  4. What is Ecological Footprint- It’s Importance and how to address the sustainability of natural resource use across the globe. Assessing current ecological supply and demand as well as historical trends provides a basis for setting goals, identifying options for action, and tracking progress toward stated goals
  5. Examples of Ecological Footprint from Natural Resources
  6. What is Ecological Footprint Footprint includes the areas for producing the resource it consumes, the space for accommodating its buildings and roads, and the ecosystems for absorbing its waste emissions such as carbon dioxide. These calculations account for each year’s prevailing technology, as productivity and technological efficiency change from year to year.
  7. What is Ecological Footprint The accounting system also tracks the supply of nature: it documents how much biologically productive area is available to provide these services (bio-capacity). Therefore, these accounts are able to compare human demand against nature’s supply of bio-capacity.
  8. Ecological Footprint consumption From Global Earth Ecosystems that provide goods and services that we live on
  9. What is Ecological Footprint Ecological Footprint : A measure of how much area of biologically productive land and wateran individual, population or activity requires to produce all the resources it consumes and to absorb the waste it generates, using prevailing technology and resource management practices.
  10. What is Ecological Footprint The Ecological Footprint is usually measured in global hectares. Because trade is global, an individual or country's Footprint includes land or sea from all over the world. Ecological Footprint is often referred to in short form as Footprint. "Ecological Footprint" and "Footprint" are proper nouns and thus should always be capitalized
  11. What is Ecological Footprint Ecological Footprint It is measured by the amount of global hectares that are affected by humans per capita of the country or any country.
  12. What is Ecological Footprint The total ecological footprint (global hectares affected by humans) is measured as a total of six factors:cropland footprint, grazing footprint, forest footprint, fishing ground footprint, carbon footprint and built-up land.
  13. What is Ecological Footprint In other words, Ecological footprint analysis compares human demands on nature with the biosphere's ability to regenerate resources and provide services. Therefore, ecological footprint per capita is the calculation as X:
  14. Major Countries for Ecological Footprint (consumption in gha in the World
  15. Percent of Earth Used is Equal to 121 % - It Is An Alarming Situation
  16. Ecological Footprint divide to items we are consuming from the Earth as %
  17. Footprint Intensity Footprint Intensity: The number of global hectares required to produce a given quantity of resource or absorb a given quantity of waste, usually expressed as global hectares per tonne.
  18. Footprint Intensity Table Footprint Intensity Table : A collection of the primary and secondary product Footprint intensities from the National Footprint Accounts. Footprint intensity is usually measured in gha per tonne of product or waste (CO2). The Footprint Intensity Table is maintained by Global Footprint Network, supported by the Network's National Accounts Committee.
  19. Measurements of Ecological Footprint global hectare (gha) : A productivity weighted area used to report both the bio-capacity of the earth, and the demand on bio-capacity (the Ecological Footprint). The global hectare is normalized to the area-weighted average productivity of biologically productive land and water in a given year.
  20. Measurements of Ecological Footprint Because different land types have different productivity, a global hectare of, for example, cropland, would occupy a smaller physical area than the much less biologically productive pasture land, as more pasture would be needed to provide the same bio-capacity as one hectare of cropland.
  21. Measurements of Ecological Footprint Because world bio-productivity varies slightly from year to year, the value of a gha may change slightly from year to year.
  22. Biologically Productive Land and Water biologically productive land and water : The land and water (both marine and inland waters) area that supports significant photosynthetic activity and the accumulation of biomass used by humans. Non-productive areas as well as marginal areas with patchy vegetation are not included.
  23. Biologically Productive Land and Water Biomassthat is not of use to humans is also not included. The total biologically productive area on land and water in 2008 was approximately 12 billion hectares.
  24. Biologically Productive Land and Water land type: The Earth's approximately 12 billion hectares of biologically productive land and water are categorized into five types of surface area: 1)cropland, 2) grazing land, 3) forest, 4) fishing ground, 5) and built-up land. Also called ”area type.” The above is our global lands that we are living on and make our productions, consumptions and our other activities for sustaining our living.
  25. How Many Hectare Productive Land Per Capita in this word To calculate the productive land per capita, you should use the total productive land on this earth and then divide by the number of people living on this earth. The total productive land on this earth by year 2008 as measured is about 12 Billion Global Hectares and the total population who are living on this earth is 6.7 Billion People in Year 2008. Therefore 12/6.7 = 1.69 global hectare/ capita in approximately. This means that 1.69 global hectare each one of us is using for our living and existence.
  26. Consumption of Goods and Services from Our Nature Consumption : Use of goods or of services. The term consumption has two different meanings, depending on context. As commonly used in regard to the Footprint, it refers to the use of goods or services.
  27. Consumption of Goods and Services from Our Nature A consumed good or service embodies all the resources, including energy, necessary to provide it to the consumer. In full life-cycle accounting, everything used along the production chain is taken into account, including any losses along the way.
  28. Consumption of Goods and Services from Our Nature For example, consumed food includes not only the plant or animal matter people eat or waste in the household, but also that lost during processing or harvest, as well as all the energy used to grow, harvest, process and transport the food.
  29. Input / Output Importance in the Understanding the Ecological Footprint As used in Input Output analysis, consumption has a strict technical meaning. Two types of consumption are distinguished: intermediate and final.
  30. Input / Output Importance in the Understanding the Ecological Footprint According to (economic) System of National Accounts terminology, intermediate consumption refers to the use of goods and services by a business in providing goods and services to other businesses.
  31. Input / Output Importance in the Understanding the Ecological Footprint Final consumption refers to non-productive use of goods and services by households, the government, the capital sector, and foreign entities.
  32. Input / Output Importance in the Understanding the Ecological Footprint IO (Input-Output) analysis : Input-Output (IO, also I-O) analysis is a mathematical tool widely used in economics to analyze the flows of goods and services between sectors in an economy, using data from IO tables.
  33. Input / Output Importance in the Understanding the Ecological Footprint IO analysis assumes that everything produced by one industry is consumed either by other industries or by final consumers, and that these consumption flows can be tracked. If the relevant data are available, IO analyses can be used to track both physical and financial flows.
  34. Input / Output Importance in the Understanding the Ecological Footprint Combined economic-environment models use IO analysis to trace the direct and indirect environmental impacts of industrial activities along production chains, or to assign these impacts to final demand categories. In Footprint studies, IO analysis can be used to apportion Footprints among production activities, or among categories of final demand, as well as in developing Consumption Land Use Matrices
  35. Input / Output Importance in the Understanding the Ecological Footprint IO (Input-Output) tables : IO tables contain the data that are used in IO analysis. IO tables provide a comprehensive picture of the flows of goods and services in an economy for a given year. In its general form an economic IO table shows uses--the purchases made by each sector of the economy in order to produce their own output, including purchases of imported commodities; and supplies--goods and services produced for intermediate and final domestic consumption, and exports.
  36. Input / Output Importance in the Understanding the Ecological Footprint IO tables often serve as the basis for the economic National Accounts produced by national statistical offices. They are also used to generate annual accounts of the Gross Domestic Product (GDP).
  37. Calculations of Ecological Footprint Cropland, pasture, forest, fisheries, and built-up areas provide for mutually exclusive demands on the biosphere, the sum of which equals the total Ecological Footprint. Each of these categories represents an area in hectares, which is then multiplied by its equivalence factor to obtain the Footprint in global hectares. Footprint (gha) = Area (ha) * Equivalence Factor (gha/ha)
  38. Calculations of Ecological Footprint To calculate the Ecological Footprint we have to use the following equation Where P is the amount of each primary product i that is harvested (or carbon dioxide emitted) in the nation; YN,i is the annual national average yield for the production of commodity i (or its carbon uptake capacity in cases where P is CO2);
  39. Calculations of Ecological Footprint Primary products. These products describe the unprocessed output of a given area, which may be used directly with minimal alteration or be processed into a secondary product. In the case of cropland, pasture, and forest this includes the immediate products of photosynthesis, such as raw fruits and vegetables, forage for livestock, or unprocessed roundwood. For fisheries, the primary products are unprocessed fish harvested from marine and inland fisheries. The Footprint of these products represents the biological and technical capacity required for their production, standardized using the average global yield:
  40. Calculations of Ecological Footprint In the case of cropland, pasture, and forest this includes the immediate products of photosynthesis, such as raw fruits and vegetables, forage for livestock, or unprocessed round-wood. For fisheries, the primary products are unprocessed fish harvested from marine and inland fisheries. The Footprint of these products represents the biological and technical capacity required for their production, standardized using the average global yield: Area in hectare (ha)= [ Production + Imports – Exports] Global yield tons/ha
  41. Calculations of Ecological Footprint Secondary products. These products are goods derived from primary products, including meat and milk, paper, and farmed fish.
  42. Calculations of Ecological Footprint Examples of primary and secondary products Component ________________________________________________________ Primary Secondary Cropland Maize Maize germoil Sunflower seed Sunflower seed oil Alfalfa Alfalfa raised beef Pasture Forage Milk Forest RoundwoodSawnwood Fuelwood none Fisheries Demersalfish Fish liver oil Pelagic fish Salmon from aquaculture
  43. Calculations of Ecological Footprint YFN,i is the country specific yield factor for the production of each product i; YW,iis the average world yield for commodity i; and EQFiis the equivalence factor for the land use type producing products i. The definition of YFN,ias the ratio between YN,iand YW,i
  44. Calculations of Ecological Footprint YW,D = YW,P · EXTRD(2) where YW,D and YW,P are the world-average yield for the derived and the primary product, respectively. EXTRD is simply the mass ratio of derived product to primary input required. This ratio is known as the technical conversion factor (FAO, 2000) for the derived product
  45. Calculations of Ecological Footprint The generalized formula for the extraction rate for a derived good D is EXTRD= TCFD/FAFD
  46. Calculations of Ecological Footprint ___________________________________________________________ Equivalence factors (1999) Bio-productive area Global hectares/ha Cropland (overall) 2.1 Primary 2.2 Marginal 1.8 Pasture 0.5 Forest 1.4 Fisheries 0.4 Built-up area 2.2a Hydropower area 1.0 Fossil Fuels (Forest) 1.4 ______________________________________________________________ Source: Loh (2002). a Note that built-up area is assumed to be located mostly on prime agricultural land. Hence, built-up area has the same equivalence factor
  47. Calculations of Ecological Footprint where AN,iis the bio-productive area that is available for the production of each product i at the country level, YFN,i is the country-specific yield factor for the land producing products i,and EQFiis the equivalence factor for the land use type producing each product i
  48. Calculations of Ecological Footprint Yield factors (YFs) account for countries’ differing levels of productivity for particular land use types. YFs are country-specific and vary by land use type and year. They may reflect natural factors such as differences in precipitation or soil quality, as well as anthropogenic differences such as management practices.
  49. Calculations of Ecological Footprint The YF is the ratio of national average to world average yields. It is calculated in terms of the annual availability of usable products. For any land use type L, a country’s yield factor YFL, is given by
  50. Calculations of Ecological Footprint where Pi is the total national annual growth of product i, and YN,iand YW,iare national and world yields for the same product, respectively. Thus AN,iis always the area that produces a given product iwithin a given country, while AW,igives the equivalent area of world-average land yielding the same product i.
  51. Calculations of Ecological Footprint In order to keep track of both the direct and indirect bio-capacity needed to support people’s consumption patterns (and to properly allocate the Footprints of traded goods to final consumers), the National Footprint Accounts use a consumer-based approach; for each land use type, the Ecological Footprint of consumption (EFC) is thus calculated as EFC= EFP+EFI−EFE where EFP is the Ecological Footprint of production and EFI and EFE are the Footprints embodied in imported and exported commodity flows, respectively
  52. Table (1) Global Population, Global Biological Capacity (GBC), Global Biological Demand (GBD) and Maintenance Index of the Planet Earth up to Year 2008 - Data are in 10 years intervals *
  53. Table (2) Predicted Values Calculated for Global Population, Global Biological Capacity (GBC), Global Biological Demand (GBD) and Maintenance Index of the Planet Earth from Year 2009-2050. The Presented Data are in 10 Years intervals
  54. Table (1) African Global Population, African Global Biological Capacity (AGBC), African Global Biological Demand (AGBD) and Maintenance Index of the African Continent up to Year 2008 - Data are in 10 years intervals * * Data Sources are World Bank- FAO – WWF – Ecological Footprint Network – WRI-Earth Trends - US estimates
  55. Table (2) Predicted Values Calculated for Global Population, Global Biological Capacity (GBC), Global Biological Demand (GBD) and Maintenance Index of the African Continent from Year 2009-2050. The Presented Data are in 10 Years intervals
  56. Ecological Footprint Capacity Schematic of direct and indirect demand for domestic and global bio-capacity
  57. Ecological Footprint and Sustainability The Ecological Footprint is a resource accounting tool used to assess sustainability. It calculates what portion of the planet's resources we, as individuals or groups, consume.
  58. Ecological Footprint and Sustainability In a sustainable world, society's demand on nature is in balance with nature's capacity to meet that demand. In order to live sustainably we need to track earth's ability to generate resources each year and how much of these we consume.
  59. Ecological Footprint and Sustainability Measuring our Ecological Footprint identifies when we are in ecological debt' and what we can do to reduce our impact. The calculation of a Footprint involves measuring consumption, such as electricity, water and food and measuring activity levels such as how far we drive and how much we spend on eating out.
  60. Ecological Footprint and Sustainability Sustainability is a simple idea. It is based on the recognition that when resources are consumed faster than they are produced or renewed, the resource is depleted and eventually used up. The natural resources such as animals and plants species, if it overused or it is overexploited will end up with the extinction of these resources and it will be irreversible conditions.
  61. Sustainability Measures Footprint Are Sustainability and Ecological Footprint in Collision With Each Other?
  62. How Are We Living on This Earth?
  63. Path to Sustainable Development and How we are Maintaining our Global Ecosystems
  64. CONCLUSIONS Footprint values at the end of a survey are categorized for Carbon, Food, Housing, and Goods and Services as well as the total footprint number of Earths needed to sustain the world's population at that level of consumption. This approach can also be applied to an activity such as the manufacturing of a product or driving of a car.
  65. CONCLUSIONS Ecological footprint analysis compares human demands on nature with the biosphere's ability to regenerate resources and provide services. It does this by assessing the biologically productive land and marine area required to produce the resources a population consumes and absorb the corresponding waste, using prevailing technology.
  66. CONCLUSIONS This resource accounting is similar to life cycle analysis wherein the consumption of energy, biomass (food, fiber), building material, water and other resources are converted into a normalized measure of land area called global hectares (gha).
  67. References Michael Boruckea, David Mooreb, Gemma Cranstonb,c, Kyle Graceya, KatsunoriIhaa, Joy Larsona, Elias Lazarusa, Juan Carlos Moralesa, Mathis Wackernagela, Alessandro Galli b (Ecological Indicators 24 (2013) 518–533): Accounting for demand and supply of the biosphere’s regenerative capacity: The National Footprint Accounts’ underlying methodology and framework. Ian Moffatt (2000) Ecological footprints and sustainable development. Ecological Economics 32 (2000) 359–362.
  68. References C. Monfreda*,1, M. Wackernagel, D. Deumling (2004). Establishing national natural capital accounts based on detailed Ecological Footprint and biological capacity assessments. Land Use Policy 21 (2004) 231–246. Daniel D. Morana,b, Mathis Wackernagela,⁎, Justin A. Kitzesa, Steven H. Goldfingera, AurélienBoutaudc (2008) Measuring sustainable development — Nation by nation E c o l o g i c a l E c o n o m i c s 6 4 ( 2 0 0 8 ) 4 7 0 – 4 7 4.
  69. Thank you for Listening and any questions
More Related