Download
1 / 35
350 likes | 538 Views
2013 Employee Engagement Survey. Executive Summary 6 December 2013. Background. Timeframe: 4 November through 18 Nov Participation Rate: 1273 respondents 72 % response rate (assuming 1765 eligible participants) Demographic Data Collected: Role Gender School / Service Faculty.

E N D
2013 Employee Engagement Survey Executive Summary 6 December 2013
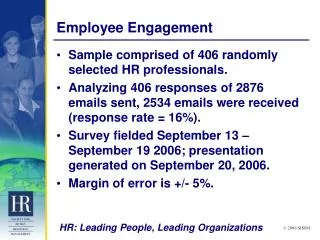
Background • Timeframe: 4 November through 18 Nov • Participation Rate: • 1273 respondents • 72%response rate (assuming 1765eligible participants) • Demographic Data Collected: • Role • Gender • School / Service • Faculty
Background • Questionnaire: • 52 core questions • 15 supplemental questions on Overall Employee Engagement • Two open-ended questions • Themes:
Background • Questionnaire: • No data is reported for groups with fewer than 10 respondents • Data Presentation: • Questions were answered on a five-point response scale with the midpoint being neutral. • The two favourable responses are combined and the two unfavourable responses are combined to produce a simplified three-response presentation (positive, neutral, and negative). • Key dimension scores are the average of the question responses that make up the dimension.
General Benchmarks for Interpreting Survey Items • Clear Strength > 65% Positive • Moderate Strength 50 – 65% Positive • Opportunity for Improvement < 50% Positive • Weakness > 25% Negative • Clear Problem > 40% Negative
Major Themes • Overall Engagement • Engagement has increased across all areas since 2011 • This reverses the trend seen in 2011, when engagement decreased over the previous year • Faculty • Largest gains seen in Health, Life and Social Science, and Business School • This reverses 2011 trend, and puts each Faculty at equal engagement levels
Major Themes - continued • Role • Positive perceptions increased in virtually all areas across all roles • Overall engagement is approximately equal across roles, with exception of Senior Management which is higher • Gender • Mirroring other demographics, positive perceptions increased in all areas for each gender • Engagement levels are approximately equal across genders
Major Themes - continued • School/Service • Due to small sample sizes, each School/Service should be examined individually for specific trends
Overall Satisfaction • Increased 7% from 2011 to 66% favourable • Reversing 2011 trends, opinions about immediate work environment improved • Immediate manager (66% fav) • The job itself (66% fav) • Significant improvement on opinions related to University environment • Willingness to “recommend University as place to work” increased by 10% to 61% favourable • Intent to stay with University up 4% to 73% favourable • Overall satisfaction improved by 10% to 64% favourable
Overall Satisfaction *Percent Favourable
Leadership • Leadership dimension increased by 9% since 2011 to 49% favourable • Notable increases in favourability since 2011, many of them significant: • Confidence in senior management decisions, up 12% (44% fav) • Effort to get people’s input, up 13% (41% fav) • Satisfaction with information from senior mgt, up 11% (43% fav) • Job security, up 24% (68% fav)
Leadership *Percent Favourable
Leadership *Percent Favourable
Atmosphere of Cooperation • Increased 6% to 59% favourable • Largest gains: • People treat one another with trust and mutual respect, up 9% (45% fav) • Satisfaction with involvement in decisions, up 9% (53% fav) • I am proud to work here, up 9% (65% fav)
Atmosphere of Cooperation *Percent Favourable
Atmosphere of Cooperation *Percent Favourable
Equity • Due to item changes, this dimension is not completely comparable to 2011 results, however the dimension did increase by 11% to 59% favourable • Significant increases around performance evaluation: • I understand how my performance is evaluated, up 12% (63% fav) • Fairness of evaluation, up 13% (69% fav) • Slight decline in perceptions of fair pay, down 2% (54% fav)
Equity *Percent Favourable
Equity *Percent Favourable
Personal Development • Increased 5% from 2011 to 55% favourable • Notable increases: • Manager takes interest in my growth, up 8% (62% fav) • Opportunities for growth and development, up 7% (53% fav) • I know what skills I’ll need to be valuable, up 12% (70% fav) • Perceptions that the University is doing what is necessary to retain talented employees improved meaningfully, though remains unfavourable
Personal Development *Percent Favourable
Personal Development *Percent Favourable
Personal Development *Percent Favourable
Overall Employee Engagement • This dimension is at 73% favourable overall • Very positive perceptions regarding trust from immediate line manager (82% fav) • Personal commitment and motivation are high (96% and 76% fav, respectively) • High focus on student experience (83%) • Overall engagement is relatively high (66% fav)
Overall Employee Engagement *Percent Favourable
Overall Employee Engagement *Percent Favourable
Overall Employee Engagement *Percent Favourable
Less Than Majority Positive (or > 25% Negative) Clear Majority Positive ( > 65% Positive) Majority Positive ( > 50% Positive) Above Avg • Good use of skills and abilities • Immediate manager behavior • Performance evaluation • Opportunities to improve skills At or Near Avg Below Avg Opportunity for Improvement Primary Strength Neither Strength nor Weakness Critical Weakness Secondary Strength Key Results Matrix • Receive needed information • Fair pay • Would recommend University • Overall Satisfaction • Opportunity for growth • Understanding of University strategy • Making necessary changes • Job security • Proud to work at University • Benefits package • Effective teamwork • Department resources • Feel valued as employee • Mutual trust & respect • Confidence in University strategy • Confidence in senior management • Sr. Mgt. communicates effectively • Cooperation between departments • Advancement, and developing & promoting from within • Retaining talented employees
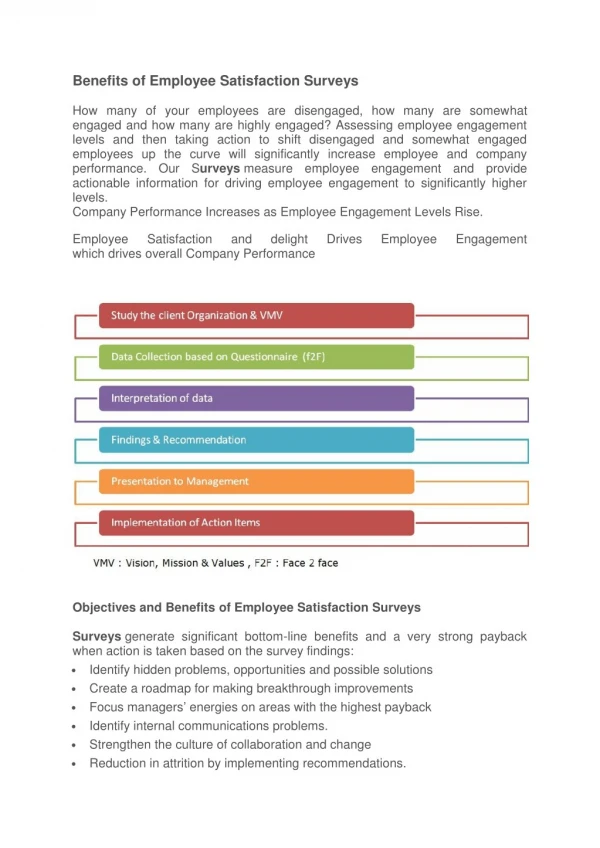
Communicating Survey Results • It is recommended that survey results be communicated to employees. Different levels of results are typically communicated utilising different methods of communication. • Organisation-level results are typically disseminated to a wider group of employees and print media is generally preferred. However, video or voice media are also effective. Results to other levels are generally communicated in smaller groups or during meetings between employees and their managers. • Organisation-Level Results • Newsletter • Memos from Top Management • Intranet/ E-mail • Other Results • Small Group Meetings • Face-to-Face Meetings between Managers and Employees • Group Newsletters or Memos
Action Planning • After determining your areas of strength and areas in need of improvement, develop a summary balance sheet (see chart on the following page). This provides a starting point for determining how to address the issues you’ve identified. It can guide you in coordinating efforts, where appropriate, with other levels of the organisation. Additionally, it clearly identifies those areas you need to address solely within a specific group. • List the strengths and weaknesses that are unique to a group (not shared with broader level organisations) in the “unique” column, and list those that are similar to broader organisations in the “shared” column. • Using the balance sheet, compare your organisation to the next highest or most logical organisation level.
Characteristics of an Effective Action Plan After you’ve reviewed and analysed your results, it’s time to take action. An effective action plan has the following characteristics: • Is fully supported by senior leadership - Having the support of senior leadership is critical to success. If the actions you are undertaking are not important to and supported by senior leaders, there is little likelihood of success. Having their support ensures focus and priority are placed on the plan. Additionally, they can help eliminate roadblocks to implementation of the plan. • Focuses on what can be done - Don’t waste time on what is not possible. Although all ideas should be considered, focus on the positive and possible. • Involves employees - Involve employees as much as possible to gain their perspective on the issues, their ideas and their commitment. • Establishes specific actions and goals - Specificity ensures clarity and leads to success. • Provides a timetable of events - Publicising the timing of events enhances the likelihood that deadlines will be met and helps inform the organisation of the changes planned. • Assigns responsibilities and accountabilities - Ensure ONE person is accountable for each action plan item. This level of accountability eliminates the potential for assuming someone else will get it done. • Describes how success will be measured - Define what success is, since this provides the goal your team needs. This target offers continual feedback to the team on the progress they are making. • Is clearly communicated - Document your action plan to ensure that everyone has the same understanding of what will occur and who is accountable.
Prioritising Your Action Plan • The final step in analysing your data and preparing to take action is to prioritise the areas you will address. Attempting to implement too many changes will dilute your focus and effort. Strive to identify 2 or 3 key issues you want to work on. Once your plans are developed and implemented, you can move to additional issues while monitoring the changes already established. • The following chart is a guide for prioritising the areas you will work on. It considers areas for improvement on two factors – Importance and Potential for Change. Priority should be placed on those issues that are important and have a high potential for change. Areas that are important, but have low potential for change can be addressed by minimising the negative impact they exert. Areas of low importance are addressed if resources permit, avoiding those that have a low potential to change.
2013 Employee Engagement Survey • Executive Summary • 6 December 2013