Download
1 / 1
10 likes | 154 Views
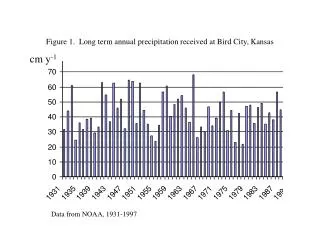
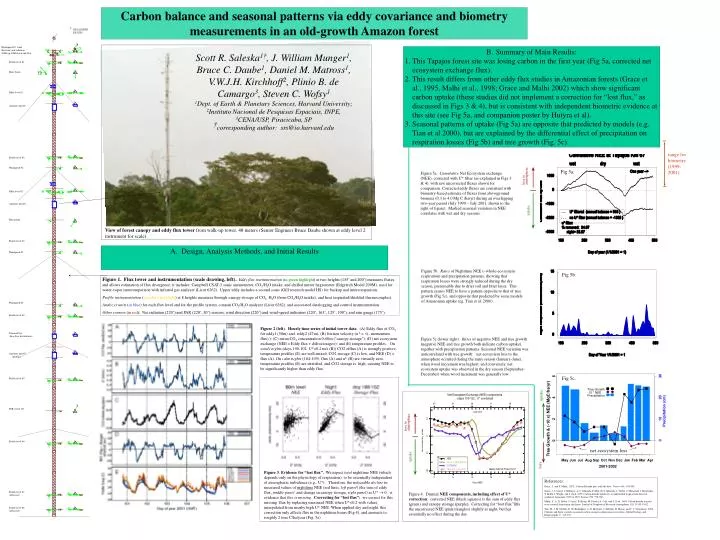
30. 6. Windspeed #1, wind direction, and radiation (PAR up, PAR down and Net). Tree Growth. -10 * NEE. Precipitation. 20. 4. Profile level #1. Precipitation (cm). Hoist boom. Tree Growth & (-10 x) NEE (MgC/ha/yr). 10. 2. Eddy level #1. 0. 0. Analyzer unit #1. May. Jun. Jul.

E N D
30 6 Windspeed #1, wind direction, and radiation (PAR up, PAR down and Net) Tree Growth -10 * NEE Precipitation 20 4 Profile level #1 Precipitation (cm) Hoist boom Tree Growth & (-10 x) NEE (MgC/ha/yr) 10 2 Eddy level #1 0 0 Analyzer unit #1 May Jun Jul Aug Sep Oct Nov Dec Jan Feb Mar Apr 2001-2002 Profile level #2 range for biometry (1999-2001) Windspeed #2 loss to atmosphere loss to atmosphere Eddy level #2 Analyzer unit #2 uptake uptake Rain gauge Profile level #3 Windspeed #3 Windspeed #4 Profile level #4 Solenoid box (tube-flow distribution) Analyzer unit #3 (profile) Profile level #5 PAR sensor #2 Profile level #6 Profile level #7(off-tower) Profile level #8(off-tower) Carbon balance and seasonal patterns via eddy covariance and biometry measurements in an old-growth Amazon forest N cross-sectional top views • Summary of Main Results: • This Tapajos forest site was losing carbon in the first year (Fig 5a, corrected net ecosystem exchange flux). • This result differs from other eddy flux studies in Amazonian forests (Grace et al., 1995, Malhi et al., 1998; Grace and Malhi 2002) which show significant carbon uptake (these studies did not implement a correction for “lost flux,” as discussed in Figs 3 & 4), but is consistent with independent biometric evidence at this site (see Fig 5a, and companion poster by Hutyra et al). • Seasonal patterns of uptake (Fig 5a) are opposite that predicted by models (e.g. Tian et al 2000), but are explained by the differential effect of precipitation on respiration losses (Fig 5b) and tree growth (Fig. 5c). Scott R. Saleska1†, J. William Munger1, Bruce C. Daube1, Daniel M. Matross1, V.W.J.H. Kirchhoff2, Plinio B. de Camargo3, Steven C. Wofsy1 1Dept. of Earth & Planetary Sciences, Harvard University; 2Instituto Nacional de Pesquisas Espaciais, INPE, 3CENA/USP, Piracicaba, SP †corresponding author: srs@io.harvard.edu Fig 5a. Figure 5a. Cumulative Net Ecosystem exchange (NEE), corrected with U* filter (as explained in Figs 3 & 4), with raw uncorrected fluxes shown for comparison. Corrected eddy fluxes are consistent with biometry-based estimate of fluxes from aboveground biomass (0.3 to 4.0 Mg C /ha/yr) during an overlapping two-year period (July 1999 – July 2001, shown to the right of figure). Marked seasonal variation in NEE correlates with wet and dry seasons. View of forest canopy and eddy flux tower from walk-up tower, 48 meters (Senior Engineer Bruce Daube shown at eddy level 2 instrument for scale). • Design, Analysis Methods, and Initial Results Figure 5b. Rates of Nighttime NEE (~whole-ecosystem respiration) and precipitation patterns, showing that respiration losses were strongly reduced during the dry season, presumably due to drier soil and litter layer. This pattern causes NEE to have a pattern opposite to that of tree growth (Fig 5c), and opposite that predicted by some models of Amazonian uptake (eg. Tian et al. 2000). Fig 5b. Figure 1. Flux tower and instrumentation (scale drawing, left).Eddy flux instrumentation (in green highlight) at two heights (155’ and 200’) measures fluxes and allows estimation of flux divergence; it includes: Campbell CSAT-3 sonic anemometer, CO2/H2O intake, and chilled mirror hygrometer (Edgetech Model 200M), used for water-vapor intercomparison with infrared gas analyzer (Licor 6262). Upper eddy includes a second sonic (Gill research model HS) for backup and intercomparison. Profile instrumentation (in yellow highlight) at 8 heights measures through-canopy storage of CO2, H2O (from CO2/H2O intake), and heat (aspirated/shielded thermocouples). Analyzer units (in blue) for each flux level and for the profile system, contain CO2/H2O analyzer (Licor 6262), and associated datalogging and control instrumentation. Other sensors (in red): Net radiation (220’) and PAR (220’, 50’) sensors, wind direction (220’) and wind-speed indicators (220’, 165’, 125’, 100’), and rain gauge (175’). Figure 2 (left). Hourly time series of initial tower data: (A) Eddy flux of CO2 for eddy1 (58m) and eddy2 (47m); (B) friction velocity (u* = (- momentum flux) ); (C) mean CO2 concentration 0-60m ("canopy storage"); (D) net ecosystem exchange (NEE = Eddy flux + d/dt<storage>); and (E) temperature profiles. On windy nights (days 100-102, U*>0.2 m/s (B)) CO2 efflux (A) is strongly positive, temperature profiles (E) are well-mixed; CO2 storage (C) is low, and NEE (D) flux (A). On calm nights (104-105), flux (A) and u* (B) are virtually zero, temperature profiles (E) are stratified, and CO2 storage is high, causing NEE to be significantly higher than eddy flux. Figure 5c (lower right). Rates of negative NEE and tree growth (negative NEE and tree growth both indicate carbon uptake), together with precipitation patterns. Seasonal NEE variation was anticorrelated with tree growth: net ecosystem loss to the atmosphere occurred during the rainy season (January-June), when wood increment was highest; and conversely, net ecosystem uptake was observed in the dry season (September-December) when wood increment was generally low. Fig 5c. uptake net ecosystem loss loss Figure 3. Evidence for “lost flux”. We expect total nighttime NEE (which depends only on the physiology of respiration), to be essentially independent of atmospheric turbulence (e.g., U*). Therefore, the noticeable decline in measured values of nighttime NEE (red lines, left panel) (the sum of eddy flux, middle panel, and change in canopy storage, right panel) as U* 0, is evidence that flux is missing.Correcting for “lost flux”: we correct for this missing flux by replacing measured NEE when U*<0.2 with values interpolated from nearby high U* NEE. When applied day and night, this correction only affects flux in the nighttime hours (Fig 4), and amounts to roughly 2 tons C/ha/year (Fig. 5a). References: Grace, J., and Y. Malhi. 2002. Carbon Dioxide goes with the flow. Nature 416: 594-595. Grace, J., J. Lloyd, J. McIntyre, A. C. Miranda, P. Meir, H. S. Miranda, C. Nobre, J. Moncrieff, J. Massheder, Y. Malhi, I. Wright, and J. Gash. 1995. Carbon-dioxide uptake by an undisturbed tropical rain-forest in southwest Amazonia, 1992 to 1993. Science 270: 778-780. Malhi, Y., A. D. Nobre, J. Grace, B. Kruijt, M. Pereira, A. Culf, and S. Scott. 1998. Carbon dioxide transfer over a central Amazonian rain forest. Journal of Geophysical Research-Atmospheres 103: 31593-31612. Tian, H., J. M. Melillo, D. W. Kicklighter, A. D. McGuire, J. Helfrich, B. Moore, and C. J. Vorosmarty. 2000. Climatic and biotic controls on annual carbon storage in Amazonian ecosystems. Global Ecology and Biogeography 9: 315-335. Figure 4. Diurnal NEE components, including effect of U* correction: corrected NEE (black squares) is the sum of eddy flux (green) and canopy storage (purple). Correcting for “lost flux”lifts the uncorrected NEE (pink triangles) slightly at night, but has essentially no effect during the day.