Download

1 / 30
300 likes | 423 Views
Scaling-Up Interventions for Preventing Reading Problems. Patricia Mathes, Ph.D. Live Chat, December 15, 2008. Presentation Goals. Participants will leave this session with:

E N D
Scaling-Up Interventions for Preventing Reading Problems Patricia Mathes, Ph.D. Live Chat, December 15, 2008
Presentation Goals Participants will leave this session with: • a deeper understanding of the challenges of maintaining and sustaining research proven instructional practices across time. • a plan for action to ensure instructional innovations continue into the future.
Life Cycle of Scaling Implementation (year 1) Sustaining (year 2) Maintaining (year 3) Institutionalization (year 4)
Tier 1: Quality Core Enhanced general education classroom instruction. Tier 2: Secondary Intervention Child receives more intense intervention in general education, presumably in small groups. Tier 3: Tertiary Intervention increases in intensity and duration. Support typically needed across years. What is Being Scaled-Up If progress is inadequate, move to next level.
Tier 1 -- Alone *extrapolated to entire population
5 Year Olds Before Learning To Read Right Left Right Left Simos, P.G., FletcherJ.M., Foorman, B.R., Francis, D.J., Castillo, E.M., Davis, R.N., Fitzgerald, M., Mathes, P.G., Denton C. & Papanicolaou, A.C. (2002). Brain activation profiles during the early stages of reading acquisition. Child Neurology.
Good Intervention Normalizes Brain Activation Patterns Before Intervention After Intervention normalized Right Left
Science Matters! SBRR vs. nonSBRR intervention nonSBRR Intervention vs. core only Data presented as Effect Sizes – anything over .20 is educationally relevant
The Real World: Tier 2 a = Early Interventions in Reading b = Responsive Reading
Questions • What are barriers and facilitators to research-supported educational practices be implemented wide-scale in schools?
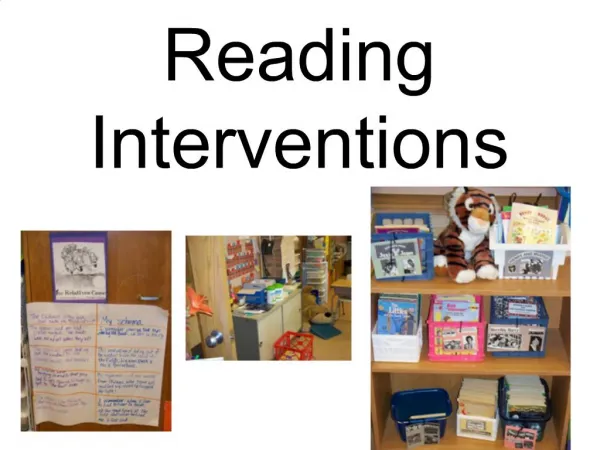
Responsive Intervention (Denton & Hocker, 2005) Systematic, explicit instruction in synthetic phonics & analogy phonics Students apply decoding, fluency, & comprehension skills while reading/ writing Teachers respond to student needs documented through assessment Leveled text (decodable can be integrated) Early Interventions in Reading(Mathes & Torgesen, 2005) Explicit instruction in synthetic phonics, with emphasis on fluency and comprehension strategies. Decodable text Carefully constructed scope and sequence designed to prevent possible confusions Daily Lessons are prescriptive Lessons are fully Specified Scaling Two Intervention **Prepublication title = Proactive Reading.
Students in both interventions performed significantly better than at-risk students in the same school who did not receive the interventions in phonological awareness, word reading, and oral reading fluency Previous Research Results
The Current Project(2004-08) • 78 Schools in the Dallas/Fort Worth and Austin areas across 4 years. • Farthest North-Farthest South: 255 Miles • Farthest East-Farthest West: 105 Miles • Schools had a choice of intervention • Large urban, suburban, and very small rural districts
Factors that Impact Outcomes • Quantity of implementation • Quality of instruction • Quantity has more power than than quality! • Both are important!
Critical Components for high levels of Quality and Quantity Coaching Teaching Expertise Leadership Scientifically-Based Curriculum
The Real World • What are the barriers to getting results? • Teacher mobility • Teacher Support • Leadership Support • Infrastructure
Teacher mobility over is a huge obstacle! 2004-05 = 45 teachers 2005-06 = 19 returning teachers (58% loss) 2006-07 = 8 returning teachers (83% total loss) 2007-08 = 4 returning teachers (92% total loss)
Teacher Support • Staff Development is not enough. • High teach mobility results in needs for ongoing support for teachers who are new implementers • Even highly expert teachers are faced with challenges. • All teachers need ongoing support.
Student Focused Coaching classroom observations Data collection and review Referencing teacher resources as needed conferencing
Virtual Coaching Data-Based and Student focused Classroom Observations Communications Teacher Resources
Coaches facilitate communication in multiple ways My coach (one-on-one discussions) My team (group discussions) Teleconferencing/videoconferencing (personal coaching) Communications
Coaching Results • On-site Coaching = to Virtual Coaching on all measures. • Both Coaching Models > On-Demand on measures of Phonemic Awareness, Alphabetic Decoding and Word Recognition • Teachers in both coaching conditions had higher implementation scores than teachers in the On-Demand Condition.
Leadership • School leadership has to support the instructional model. • Protecting time. • Building infrastructure
Effective Model Intervention teacher(s) provides small group in addition to core through-out the day. Special education, Title1, and general education work together seamlessly. Ineffective Model General education teacher provides both core and Tier 2 intervention. Special services don’t become involved until Tier 3. Infrastructure
Life Cycle of Scaling Implementation (year 1) Sustaining (year 2) Maintaining (year 3) Institutionalization (year 4)
Life cycle of scaling Implementation (year 1) Sustaining (year 2) Maintaining (year 3) Institutionalization (year 3)
Planning for the Future How will you ensure that the instructional innovations implemented are sustained? • Ongoing Implementation activities? • Ongoing teacher support systems? • Leadership development and support? • Creative funding (Title 1; Special Education – RTI)?
For further information, contact: pmathes@smu.edu Institute for Reading Research http://www.smu.edu/irr