Download
1 / 17
170 likes | 175 Views
Environmental assessment of the deep-water ecosystem to the West of the British Isles. Pascal Lorance & Verena Trenkel, Ifremer, France Leonie Dransfeld, Marine Institute, Ireland Chris Barrio Frojan, Andrew Kenny & Phil Large, Cefas, UK. Background.

E N D
Environmental assessment of the deep-water ecosystem to the West of the British Isles Pascal Lorance & Verena Trenkel, Ifremer, France Leonie Dransfeld, Marine Institute, Ireland Chris Barrio Frojan,Andrew Kenny & Phil Large, Cefas, UK
Background • Ecosystem-based management requires information for monitoring of changes in state and dynamics of exploited populations, assemblages and communities • In the wider perspective of the European Marine Strategy Framework Directive (2008) all ecosystem components are monitored and management actions are required if they are not in good environmental health Aim: Collate information for assessing the status of the deep-water ecosystem to the West of the British Isles and identify data and knowledge gaps.
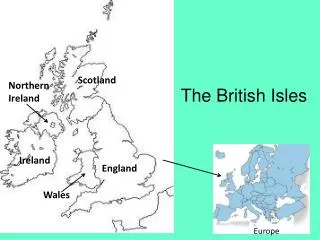
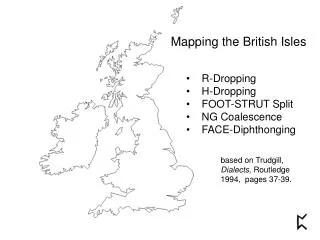
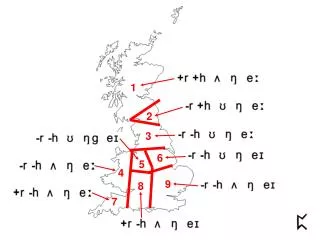
Studied continental slope area Area considered: - continental slope and seabed 400-500 to 2000m - continental slope 200 - 400 m (grey area) not included
Ecosystem description Environmental features Detritus, bacteria & micro-organisms Primary producers Zooplankton Benthos Nektonicinvertebrates Vertebrates Sedimentary substrate Soft sediment fauna Fish Marinemammals Carbonated mounds SurfacePhytoplankton Other features VMEs Birds Hydrology Turtles (minor in the areas)
Ecosystem description Environmental features Detritus, bacteria & micro-organisms Primary producers Zooplankton Benthos Nektonicinvertebrates Vertebrates Sedimentary substrate Soft sediment fauna Fish Marinemammals Carbonated mounds SurfacePhytoplankton Other features VMEs Current and internal waves Birds Hydrology Hydrology Water circulation Turtles (minor in the areas) Acidity Temperature Physical parameters Oxygen
Environmental features Detritus, bacteria & micro-organisms Primary producers Zooplankton Benthos Nektonicinvertebrates Vertebrates Sedimentary substrate Soft sediment fauna Fish Marinemammals Carbonated mounds SurfacePhytoplankton Other features VMEs Birds Hydrology CWC reefs Turtles (minor in the areas) VMEs Coral gardens Sponge communities Benthos
Fish community Leafscale gulper sharks Fish Vulnerable species Portuguese dogfish Exploited species Other sharks, rays and chimaeras Environmental features Detritus, bacteria & micro-organisms Primary producers Zooplankton Benthos Nektonicinvertebrates Vertebrates Orange roughy Sedimentary substrate Soft sediment fauna Fish Marinemammals Carbonated mounds SurfacePhytoplankton Other features VMEs Birds Hydrology Turtles (minor in the areas) Benthos Vertebrates level of disaggregation depends upon data availablity
Qualitative descriptors for good environmental status (EU MSFD 2008) Biodiversity Biological diversity is maintained. The quality and occurrence of habitats and the distribution and abundance of species are in line with prevailing physiographic, geographic and climatic conditions. Introduced species Commercial species Food web Eutrophication Sea floor integrity Hydrology Contaminants Seafood Litter Disturbance
Approach for defining GES For each qualitative descriptor • Identify ecosystem component • Select pertinent metrics for each component • Determine reference levels/points • Assemble data and information • Carry out initial state assessment (2012 for EU MFSD) • Identify anthropogenic pressures responsible for adverse impact GES = good environmental status
Anthropogenic pressures and impacts Examples • Physical loss • Smothering (man-made structures) • Sealing (permanent construction) • Other physical disturbance • Introduction of noise or light • marine litter • Biological disturbance • Selective extraction of species (fishing)
Elements for biodiversity status assessment At species level Non-commercial fish species Corals Lophelia pertusa Nezumia aequalis Density Mean length Not GES in South Impact by bottom trawls Neat & Burns (2010) Ospar (2009) Expected GOOD Eg OSPAR habitats: Lophelia reefs Coral gardens… Set of relevant species and habitats
Elements for commercial species Status Fract. expl. Metrics Expected Good (currently improving) • blue ling mature catch/LPUE, length, age • black scabbardfish pre-adult catch/LPUE, Bad • roundnose grenadier all harvest rate 0.12-0.5, survey • orange roughy all landings, survey 2005 • 2 siki sharks adult catch/LPUE Currently unknown • greater forkbeard all survey indices Overfishing
Blue ling Roundose grenadier Landings per unit effort Landings per unit effort Long-term decline in LPUE for all species Mean size in catch Overfishing Other indicator: fishing pressure vs MSY reference points Lorance et al. (2010)
Elements for the food web Biomass of key prey species Abundance of top predators Good • Atlantic white-sided dolphin North Atlantic IUCN least concerned Bad • Sperm whale world wide IUCN vulnerable Unknown • long-finned pilot whale North Atlantic IUCN data defficient Blue whiting SSB GOOD Overharvested ICES (2009) The MSFD does not implies assessment to rely upon food web modelling but suggest a number of indicators that reflects the functioning of the food web to be monitored
Elements for other descriptors Eutrophication Sea floor • Extent of seabed affected by human activities • Benthos diversity, size structure functionning • Oxygen No impacts from coastal run-offs in offshore area unknown GOOD GOOD Hydrological conditions Contaminants (in the ecosystem) No known alterations No information available GOOD unknown
Data and knowledge gaps Qualitative DescriptorGood environmental status • Biodiversity Yes & No, physical impact, overfishing (*) • Introduced species Yes / not relevant • Commercial species Yes & No, overfishing (*) • Food web Yes & No, overfishing(*) • Eutrophication Yes • Sea floor integrity Unknown (*) • Hydrology Yes • Contaminants Unknown (*) • Seafood Yes • Litter Unknown (*) • Disturbance Unknown (*) (*) processing of current monitoring (eg VMS) and additional monitoring
Conclusions • Qualitative and quantitive information exists for evaluating status of deep-water ecosystem • Lack of information for assessing status of sea floor (benthos), contaminants, litter and energy disturbance • Bottom trawling is the most important direct anthropogenic pressure • How to deal with uncertainty ? • Which additional monitoring is required ?