Download
1 / 58
600 likes | 757 Views
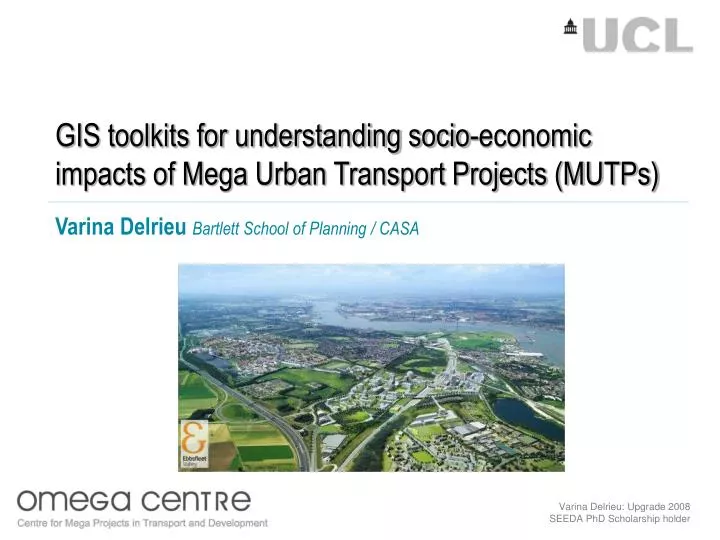
GIS toolkits for understanding socio-economic impacts of Mega Urban Transport Projects (MUTPs). Varina Delrieu Bartlett School of Planning / CASA.

E N D
GIS toolkits for understanding socio-economic impacts of Mega Urban Transport Projects (MUTPs) Varina Delrieu Bartlett School of Planning / CASA
My research explores the impacts Mega Urban Transport Projects (MUTPs) have on urban communities by exploring changes in socio-demographic profile, accessibility and deprivation over time. I am interested in sustainable development and want to know to what extent we can visually explore issues such as social-cohesion/exclusion, sustainable mobility and affordability. I use GIS to spatially analyse data at the smallest spatio-temporal scale and look at ways that the results can be mapped to help urban planners evaluate and appraise an MUTP. The MUTPs under study are two inter-urban railways; Channel Tunnel Rail Link ‘High-Speed 1’ and 2 hubs (Ashford and Ebbsfleet) in the UK, and KCRC West Rail Extension and 2 hubs (Tuen Mun and Yuen Long) in Hong Kong , so as to explore the effects of context on the impacts. ABSTRACT
STRUCTURE OF RESEARCH: • Research Aims & Objectives • Overview of contextual and theoretical frameworks • Hypotheses & Research Questions in brief • Outline of my Methodology • Work Flowchart Introduction Contextual Framework Theoretical Framework Methodology GIS Toolkits Analysis & Discussion Summary & Conclusion
STRUCTURE OF RESEARCH: • Background to MUTP and Impact Studies • Planning Frameworks (UK & Hong Kong) • Sustainability Challenges • Overview of IT Planning Support Systems Introduction Contextual Framework Theoretical Framework Methodology GIS Toolkits Analysis & Discussion Summary & Conclusion
STRUCTURE OF RESEARCH: Introduction Contextual Framework Theoretical Framework Methodology GIS Toolkits Analysis & Discussion Summary & Conclusion • Two main indicator toolkits: literature review: • Accessibility: GIS and key research themes • Deprivation Indices: GIS and key research themes • Emerging Issues Analysis
STRUCTURE OF RESEARCH: Introduction Contextual Framework Theoretical Framework Methodology GIS Toolkits Analysis & Discussion Summary & Conclusion • Hypotheses and Research Questions • Case-Studies: CTRL & WestRail • Quantitative Datasets • Qualitative Datasets • Spatial Analytical techniques
STRUCTURE OF RESEARCH: Introduction Contextual Framework Theoretical Framework Methodology GIS Toolkits Analysis & Discussion Summary & Conclusion • Coding and implementing a GIS toolkit • Spatial analysis • Visualisation and mapping outputs • Creation of impact indicators • Error Checking and Testing the toolkit
STRUCTURE OF RESEARCH: Introduction Contextual Framework Theoretical Framework Methodology GIS Toolkits Analysis & Discussion Summary & Conclusion • Pattern recognition and interpretation • Testing the hypotheses and answering the • research questions • Lessons for decision-makers
STRUCTURE OF RESEARCH: Introduction Contextual Framework Theoretical Framework Methodology GIS Toolkits Analysis & Discussion Summary & Conclusion • Potential uses for the toolkit • Theoretical and technical Critiques • Areas for future research
Research Context: Study of Decision-making in Planning, Appraising and Evaluating MUTPs and their Impacts. This project critically examines thirty international experiences in the planning, appraisal and evaluation of Mega Urban Transport Projects (MUTPs) and their impacts in the Developed World. Its overall aim is to ascertain what constitutes a ´successful mega urban transport project´ in the context of our fast changing world where visions of sustainable development are increasingly coming to the fore as a basis for assessing future development. The OMEGA Centre, BSP MUTP Definition: MUTPs are confined to post-1990 completed road, rail, bridge, tunnel or projects combining these types of links, costing in excess of US$500m (at 1990 prices), located either within urban areas or having a significant impact on urban and metropolitan development.
To create a toolkit that explores Accessibility, Deprivation Indices and Demographic Profiles as key indicators of socio-economic and change. Utilising a range of datasets with spatial and temporal variables, the GIS will assess the effects of the MUTP and short- and long-term costs and benefits. The synthesis of the toolkits’ output will provide a broader understanding of changes, and must be easily communicable to a wide user-group, such as policy-makers, planners and urban developers so as to play a role in the planning, appraisal and evaluation of MUTPs. AIM
1. To identify and derive impact indicators from aggregated datasets across different contexts 2. To clarify if ‘context is everything’ or what - if any - generic lessons for decision makers can be identified 3.To contribute to the OMEGA Centre’s question ‘What constitutes a successful MUTP?’ by discussion of the impacts, costs and benefits potentially derived from assessment of my case-studies 4. To discern what are the strengths and weaknesses in using GIS as a tool to reach the above objectives OBJECTIVES
PART 1: GIS and the CONTEXT of the MUTP Hypothesis 1: “Context is everything” Question 1a: How can we develop GIS-based tools that enhance knowledge of a range of impacts when planning a large urban project, given the breadth of diversity in the projects’ contexts? Question 1b: What is the degree of correlation between outcomes of decisions made for similar infrastructure projects in different context and how these can be compared and visualised? Question 1c: How can qualitative Pre-Hypothesis Narrative Pattern Analysis data and Hypothesis-led questionnaire data from project stakeholder interviews be incorporated into a ‘map’ of the project in a meaningful way so as to enrich the quantitative datasets? HYPOTHESES & RESEARCH QUESTIONS
PART 2: GIS and the IMPACTS of the MUTP What is an ‘impact’? First Order: Direct changes, cost or benefit to the natural / built environment and population caused by the project itself Second Order: Indirect changes, cost or benefit to the natural / built environment and population, where the MUTP can be considered the most influential catalyst for the changes; i.e. outcomes attributed to first order impacts * Ability to assess impacts is affected by SCALE, both in a geographical, and cost vs. benefit sense Hypothesis 2: “GIS can draw out spatial patterning that indicates socio-economic process that can be considered impacts of MUTPs” Question 2: What spatially-embedded i) Social ii) Economic iii) Physical variables produce the most reliable and comparable indicators of the impacts of key-decisions across a wide scope of mega transport projects? HYPOTHESES & RESEARCH QUESTIONS
PART 3: GIS and MUTP SUSTAINABILITY CHALLENGES Hypothesis 3: “Accessibility Measures and Deprivation Indices can together provide a means to explore sustainability challenges such as social cohesion / exclusion, sustainable mobility and affordability” Sub-Hypothesis 3a: “MUTPs improve social cohesion between pre-existing communities around an MUTP” Sub-Hypothesis 3b: “MUTPs induce social exclusion between the pre-existing communities and the newly developed communities around an MUTP” Questions 3a: Can aspects of sustainability through which an MUTP can be judged, be spatially analysed, especially as these are expected to be weighted differently in terms of their importance in different spatio-temporal contexts (this refers closely to the change in the sustainability agenda over a Project’s lifespan)? Question 3b: What factors can be considered to advance social exclusion? Question 3c: By which indices can we measure ‘affordability’ against? HYPOTHESES & RESEARCH QUESTIONS
DATA FLOWCHART
2.2 How are I.T. and digital mapping tools assisting decision-makers? Section 2 Contextual Framework:OVERVIEW OF I.T. SUPPORT SYSTEMS IN MEGA URBAN AND TRANSPORT PLANNING Planning support / decision-making systems in local and national urban and transport planning Planning support / decision-making systems in non-UK urban & transport planning (some focus on Hong Kong) GIS-T: Geographical Information Systems for Transport
2.3History of definitions, topics, developments, key papers and concepts, regarding planning, appraising and evaluating MUTPs Includes planning frameworks in the UK and Hong Kong Section 2 Contextual Framework:BACKGROUND TO MEGA URBAN TRANSPORT PROJECTS AND IMPACT STUDIES RPG9a (1995) What constitutes a ‘successful’ MUTP, in the past, now and in the future…? Sustainability challenges: spatio-temporal and politically contextual significance to my research i.e. Social Cohesion/Exclusion, Affordability and Sustainable Mobility
2.1.1Accessibility[network / economic] 2.1.2Deprivation Indices[locational / social] How these are important potential key spatial impact indicators of socio-economic change in urban communities post-MUTP? Refer to research questions and hypotheses Section 3 Theoretical Framework:THEORY AND APPLICATIONS OF THE TWO MAIN INDICATOR TOOLKIT AREAS
Section 3 Theoretical Framework:ACCESSIBILITY: THEORY AND APPLICATIONS Ebbsfleet resident’s Home Fastrack bus, cycling or walking (car?) MUTP: High Speed 1 – Domestic Service Place of Work [ adapted Murray et al. 1998: fig.1]
3.1Introduction 3.2 Accessibility measures: perspectives and components What is Accessibility? Transportation component Land-use component Temporal component Individual component Section 3 Theoretical Framework:ACCESSIBILITY: THEORY AND APPLICATIONS
Section 3 Theoretical Framework:ACCESSIBILITY: THEORY AND APPLICATIONS
3.3 Accessibility measures: perspectives and components Measures: descriptions, examples, strengths and shortcomings: Transport Infrastructure-based accessibility measures Location-based accessibility measures: Distance Contour / Cumulative Opportunities Potential accessibility / Gravity-based measures Adapted Potential accessibility measure Person-based accessibility measures Utility-based accessibility measures Section 3 Theoretical Framework:ACCESSIBILITY: THEORY AND APPLICATIONS
3.4 Accessibility studies and spatial / technological toolkits: an overview of methodology and research techniques GIS, Accessibility and Transportation Networks Intra-Urban Public Transportation * Inter-Urban (High-Speed) Rail Transportation GIS, Accessibility and Land Use GIS, Accessibility and Person-based measures Section 3 Theoretical Framework:ACCESSIBILITY: THEORY AND APPLICATIONS
Accessibility & GIS: Section 3 Theoretical Framework:ACCESSIBILITY: THEORY AND APPLICATIONS Flowchart of a suggested GIS process to measure accessibility (Liu and Zhu 2004b:50)
Section 3 Theoretical Framework:ACCESSIBILITY: THEORY AND APPLICATIONS Digitising topological data for GIS: Kent Thameside Bus Network: (Access to the CTRL) Changes over time? Accessibility & GIS: transportationdata
Accessibility & GIS: Public transportation on the periphery of Glasgow Section 3 Theoretical Framework:ACCESSIBILITY: THEORY AND APPLICATIONS [ Illustration of Easterhouse accessibility: O’Sullivan 2000 et al: Fig.9]
Accessibility & GIS: changes following the construction of a new Mass Rapid Transit Line in Singapore Section 3 Theoretical Framework:ACCESSIBILITY: THEORY AND APPLICATIONS [ Illustration of 2D & 3D maps: Lui & Zhu 2003: Fig.6]
Accessibility & GIS: Confidence Ellipses, Kernel Density Estimators and Shortest Path Networks: a study in analytical techniques Section 3 Theoretical Framework:ACCESSIBILITY: THEORY AND APPLICATIONS [Schönfelder & Axhausen 2003]
3.5 GIS / spatial technology and accessibility measures: Discussion How successfully can I adopt aspects of these approaches to explore the issues of socio-economic impacts and sustainability? Scales of analysis; are there any cost and benefits of spatial, temporal or attribute data resolution? How convincing and thorough were any geo-statistics and spatial analyses? Level of programming and integration with the GIS A summary of the prevalent shortcomings How helpful are these approaches and techniques to assess MUTP impacts? Section 3 Theoretical Framework:ACCESSIBILITY: THEORY AND APPLICATIONS
3.6 Access & Accessibility and Key Research Themes: Accessibility as a social impact indicator Accessibility as an economic impact indicator Accessibility and sustainability Section 3 Theoretical Framework:ACCESSIBILITY: THEORY AND APPLICATIONS Loosely based upon Preston and Raje (2007)
Section 3 Theoretical Framework:ACCESSIBILITY: THEORY AND APPLICATIONS Pennycook et al. 2001
Criteria for choosing the most ‘suitable’ accessibility measure: Aim of the evaluation Availability and quality of the primary datasets Interpretability and communication for end-users Paths for further research Articulation with hypothesis of impacts of MUTPs Section 3 Theoretical Framework:ACCESSIBILITY: THEORY AND APPLICATIONS
(Relative) Deprivation (UK); measured by the government since 1981 ‘Carstairs Scores’ 1981 & 1991: 4 variables in Census dataset Index of Deprivation 2000 (ID2000): released at Small Area level Index of Multiple Deprivation 2004 (IMD2004) – updated and expanded from ID2000. Released at Super Output Area lower level Indices of Deprivation 2007 (ID 2007): released Dec 07 Section 3 Theoretical Framework:DEPRIVATION INDICES: THEORY AND APPLICATIONS Deprivation relates to the lack of a resource which is needed for a basic standard of life. There are many different types of deprivation and people can be deprived of one or more of these resources. Kent County Council website 2007
Section 3 Theoretical Framework:DEPRIVATION INDICES: THEORY AND APPLICATIONS • Seven ‘domains’: (Domain Weight) • Income deprivation (22.5%) • Employment deprivation (22.5%) • Health deprivation and disability (13.5%) • Education, skills and training deprivation (13.5%) • Barriers to housing and services (9.3%) • Crime (9.3%) • Living Environment deprivation (9.3%)
4.1Where are the case studies and why were they chosen: Case-study 1: Channel Tunnel Rail Link (High-Speed 1) hubs Section 4:OVERVIEW OF THE CASE STUDIES AND DATASETS Digimap Edina datasets
Case-study 1a: CTRL hub Ebbsfleet: Thameside Gateway Section 4:OVERVIEW OF THE CASE STUDIES AND DATASETS
Case-study 1a: CTRL hub Ebbsfleet: Kent Thameside Section 4:OVERVIEW OF THE CASE STUDIES AND DATASETS www.gravesham.gov.uk/media/images/r/j/KTDevelopmentMapLarge_1.gif
Case-study 1a: CTRL hub EbbsfleetMasterplan(s): Section 4:OVERVIEW OF THE CASE STUDIES AND DATASETS www.ebbsfleetvalley.com
Case-study 1b: CTRL hub Ashford Masterplan to 2031: Section 4:OVERVIEW OF THE CASE STUDIES AND DATASETS Identified as one of four major 'growth areas' for the South East in the Government’s Sustainable Communities Plan.
Where are the case studies and why were they chosen: Case-study 2: Hong-Kong KCRC WestRail Extension Section 4:OVERVIEW OF THE CASE STUDIES AND DATASETS
Case-study 2a: WestRail Hub Yuen Long District Section 4:OVERVIEW OF THE CASE STUDIES AND DATASETS
Case-study 2b: WestRail Hub Tuen Mun District Section 4:OVERVIEW OF THE CASE STUDIES AND DATASETS
Section 4:OVERVIEW OF THE CASE STUDIES AND DATASETS Deprivation in Hong Kong SAR: Census 1996 Forrester et al (2004)
6.1.4Boundaries: how to select and define the spatial & conceptual boundaries? 6.2The importance of context: socio-economic, cultural, political, spatial and temporal: how are these impacting on the case- studies? Is context explaining some of the emerging issues but not others? Are there unanticipated emerging issues? 6.3 Spatio-temporal datasets data sources / issues / processing 6.4Socio-economic datasets data sources / issues / processing Section 4:OVERVIEW OF THE CASE STUDIES AND DATASETS
4.3GIS datasets: Geographical extent Section 4:OVERVIEW OF THE CASE STUDIES AND DATASETS Spatial Data collected for SE / E England and London
Section 4:OVERVIEW OF THE CASE STUDIES AND DATASETS 4.3GIS datasets: Geographical extent Road and train infrastructure data; (2006) From OS: Strategi (1:250,000 ) Meridian 2 (1:50,000)
Section 4:OVERVIEW OF THE CASE STUDIES AND DATASETS 4.3GIS datasets: Spatio-Temporal extent Polygons of the smallest Census areas for 4 decades