Download
1 / 36
410 likes | 690 Views
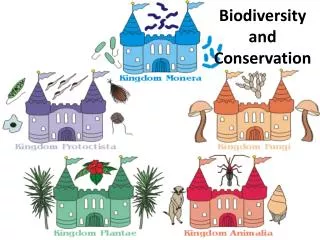
Biodiversity and Single Species Conservation . Generally we measure diversity at the species level, but biodiversity can be measured at other taxonomic levels Kingdom Phylum Class Order Family Genus Species subspecies

E N D
Generally we measure diversity at the species level, but biodiversity can be measured at other taxonomic levels Kingdom Phylum Class Order Family Genus Species subspecies The higher taxonomic levels are not usually used, but the lower levels (e.g., Family and below) are often used and can be more informative than species level diversity The level may be different, but the measure is the same
Subspecies is an interesting group A subspecies is a population that is morphologically or genetically distinct from other populations within the species It is not so distinct as to be its own species Subspecies represent adaptation to local conditions, the species changes slightly in order to be better adapted to the selection pressures they encounter Remember the beach mouse?
Subspecies introduce two other “groups” of biodiversity Genetic diversity—the diversity (or number) of alleles present in a population Population diversity—the number of distinct populations of a species that are found in an area These are much more difficult to measure One cannot sample the entire genome of each individual, so one must index genetic diversity by measuring the diversity of small segments of DNA In most species population diversity is even less easy to measure (where does one population start and the other stop?) but in some species it is especially instructive
Diversity also can be measured at different spatial scales α-diversity is calculated at a single site β-diversity is at a larger scale across several sites γ-diversity is at a very large scale These measures can tell us different things If the measures are similar then the biotas at different sites are very similar, if the measure are different then so are the biotas The important point is that there are many types of diversity and one must be specific about what types of diversity are being used
At its core though biodiversity means the number of species on Earth So how many species are on Earth? Unfortunately that is a question without a very satisfying answer First: What is a species? A simple question without a simple answer Biological species concept—a species is a group of organisms that are reproductively isolated from other organisms Empirical definition—but has a few weaknesses: groups some “distinct” species into one (e.g., coyote and wolf), does not work for asexual species Evolutionary species concept—a species is a lineage that has a unique evolutionary history not an empirical definition
But lets assume that we have a perfect definition of a species we still can only estimate the number of species on Earth Some areas are well studied, some are less so (e.g., the tropics) Because of this many “new” species (~20,000) are described every year (most of these are insects, bacteria etc) Current estimates are that there are ~1.6 million described species, but many scientists estimate that this represents less than half of the true biological diversity of the planet Category Species Totals Vertebrates 59,811 Invertebrates 1,203,375 Plants 297,326 Lichens 10,000 Mushrooms 16,000 Brown algae 2,849 TOTAL SPECIES 1,589,361
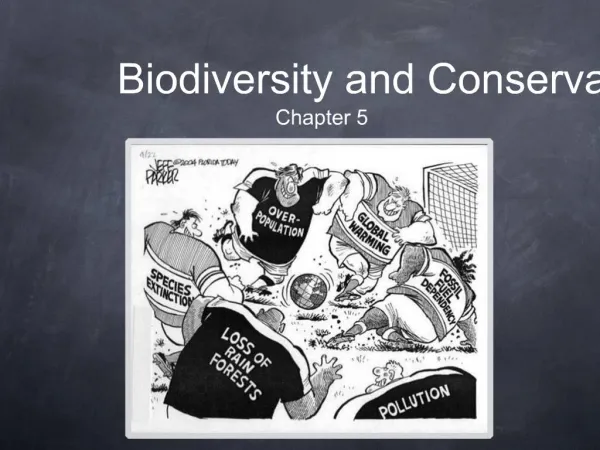
Although there are issues, we do have a good idea of patterns in biodiversity Biodiversity is not the same across the face of the Earth Some areas are much more diverse than others Biodiversity changes among biomes Biome—Large regional or subcontinental system characterized by a particular major vegetation type and distinguished by the predominant plants associated with a particular climate
So the most diverse sites are tropical and the least diverse areas are located near the poles
This leads to the idea of the latitudinal gradient in species richness Species richness/diversity is inversely related to latitude Diversity is lowest at high latitudes (near the poles) and greatest at low latitudes (near equator)
At finer scales richness/diversity will vary from site to site and within a site over time Diversity will vary with disturbance Richness/diversity is low both when disturbance is frequent (or recent) AND when it is rare (or a long time ago) Highest when there is moderate amounts of disturbance Intermediate Disturbance Hypothesis
Diversity also varies with changes in primary productivity At large scales diversity increases with increased productivity At local scales the relationship is unimodal, highest diversity at moderate levels of productivity Paradox of Enrichment
So what is behind the changes in biodiversity? • Well that is a very complicated answer that likely varies among the • observed patterns, but we can still go through some rules of thumb • Increased productivity increases richness • Obviously there are exceptions to this but generally increased productivity • increases the amount of energy available to consumers • This increased energy can support more individuals and presumably • more species 10J 100J 10J 1,000J 100J 10,000J 1,000J 100,000J 10,000J
Constant conditions within the ecosystem • Continents have changed positions throughout history • The climate has changed throughout history • The tropics have remained tropical throughout most of this period, • relatively immune to changes in climate • This constancy means that selection pressures remain similar overtime • and allow species to persist whereas in temperate regions the climate • shifts which causes some species to go extinct, reducing diversity • The tropics also are immune to glaciation, temperate regions are • heavily influenced by glaciers (every 10,000 years)
High diversity increases rates of speciation • High levels of diversity tends to push species towards specialization • Species start dividing up the resources to decrease competition • Some of this will be within a species that can result in divergent • selection pressure and then speciation • So if there are more species there will be more competition and more • impetus to specialize which leads to more species and on and on
Increased isolation increase speciation • As the continents drifted apart in the Cretaceous the number of • species on the plant increased • Increased isolation decreases gene flow—essentially populations evolve • in isolation from other populations of the same species • Over time this increases the number of species (may not change the • number within continents but does change the sum total across the globe)
Isolation results in high rates of endemism Endemic species are those that are found in a single region and nowhere else Before the breakup of Pangea there likely was little endemism anywhere on Earth Now most species are endemic to continents We will use endemism mainly to refer to species that are highly isolated being found in a small geographic area (e.g., lemurs in Madagascar)
Species interactions also influence diversity • This influence can be both positive and negative • Mutualism and competition can drive specialization that helps to • increase diversity • But competition can reduce diversity as well • When resources are abundant a competitively dominant species (or • group of species) can exclude other species • This is thought to be the mechanism responsible for the IDH
Species-specific approaches to conservation OIdest form of conservation: find a species in trouble and conserve it Must demonstrate risk to population and then have enough information to design conservation measures
species are logical “endpoints” for evolution (at least over ecological time scales). conservation legislation and classifications (e.g., US Endangered Species Act, IUCN Red List, CITES) focus on species public can relate to some species—flagship species Umbrella species—if one conserves a wide ranging species other, less charismatic species will benefit
Population viability analysis quantitative method used to predict future status of one or more populations of conservation concern Allows prediction of extinction probability Allows “experimental” management
PVAs require considerable data to parameterize Demographic stochasticity—variability among individuals in survival and reproduction Environmental stochasticity—variability in survival and reproduction due to variability in environment Correlations among vital rates—survival and reproduction may vary in concert which can affect population growth rate
Small effective population sizes result in lower genetic diversity due to genetic drift Loss of genetic diversity leads to less ability to adapt and inbreeding depression
All of this leads to the idea of the extinction vortex Small populations have low genetic diversity that leads to lower reproductive success that leads to a lower population that leads to lower reproductive success
This leads to the idea of the minimum viable population The MVP is the minimum population size that has a statistical probability of remaining extant Essentially the smallest population that has a low probability of going extinct Determining the MVP is an art as much as a science
There are several examples of successful captive breeding programs Both the black-footed ferret and California condor have been successfully bred in captivity and released to the wild The results of the releases have been variable but there is hope However, these projects are intensive
For both species all known individuals were brought into captivity and young reared The condors were raised with puppets To work in the ferret breeding program one is not allowed to have pets at home to reduce disease transmission The projects are expensive and there is no guarantee of success The offspring are not “wild”
Once one has individuals to release (or if one is attempting to conserve a wild population one must know what habitats are available for the species Often we use a Habitat Suitability Index to determine the quality of various habitats that are available for the species An HSI is developed from all of the research on a species and it niche requirements Sometimes one must use a closely related species Niche conservatism—the idea that closely related species share a similar niche since they shared a recent common ancestor
One can use these data to determine the quality of habitat based on a variety of characteristics Habitats are scored based on the presence or absence of characters and the areas that have the highest score are the best habitats
This leads into our next concept The landscape is not homogeneous, there is variability in the quality of habitat This is due to both variability in the habitat and anthropogenic effects
We can combine several ideas in ecology to model a population at landscape level scales We combine habitat use, demography and the Theory of Island Biogeography to develop the models These types of models are called Spatially Explicit Population Models
Theory of Island Biogeography High High Small Near Colonization Extinction Large Far Low Low Species richness
Combine data on habitat suitability, demography based on the suitability, isolation of the patch and dispersal ability of the species Once all of these data are combined one can assign a population growth rate to each patch of habitat
Each color is associated with a range of population growth rates These population growth rates are assigned to every grid square on the map and viola!
We have a landscape model of the habitat suitability and demography of the population This map can then be used to identify areas critical to the survival of the species or areas suitable for reintroduction