Download
1 / 37
440 likes | 856 Views
ECMWF Meteorological Training Course Numerical Weather Prediction Data Assimilation and Use of Satellite Data (NWP-DA). ECMWF ReAnalysis (ERA) Data assimilation aspects. Paul Poli paul.poli@ecmwf.int. Reanalysis course outline. The three pillars of geosciences. Argo Float.

E N D
ECMWF Meteorological Training Course Numerical Weather Prediction Data Assimilation and Use of Satellite Data (NWP-DA) ECMWF ReAnalysis (ERA)Data assimilation aspects Paul Polipaul.poli@ecmwf.int ECMWF NWP-DA Reanalysis
Reanalysis course outline ECMWF NWP-DA Reanalysis
The threepillars of geosciences ArgoFloat Polar-orbiting Satellite Geostationary Satellite Bathythermograph Aircraft Buoy Balloon, Radiosonde Ship • Errors in observations • Errors in models • Predictability • Variability Observer (Semi-) Automatic Station ECMWF NWP-DA Reanalysis
Objective: Reconstruct the past “Observations-only” climatology Gross exaggeration towards discontinuity Reanalysis “Model only” integration Gross exaggeration towards continuity ECMWF NWP-DA Reanalysis
Reanalysis products and Reanalysis process • Reanalysis products • Gridded fields of NWP model • Control variables: vorticity, divergence, temperature, humidity, ozone… • Derived variables: precipitation, radiation… • Fit to observations • Before, and after, assimilation • Before, and after, bias correction • Reanalysis process • Integration of an invariant, modern version of a data assimilation system and numerical weather prediction model,over a long time period,assimilating a selection of observations ECMWF NWP-DA Reanalysis
Differences with observations-only gridded datasets Observations-only datasets are the “observation limit” of reanalyses. They are extremely important for improving understanding. ECMWF NWP-DA Reanalysis
Why re-analyze?Overall aim is a greater time-consistency of the products 1 May 2011 1 Feb 1985 Was there a sudden change inSouth Pole summer variability in 1997? 1 May 2011 1 Feb 1985 … probably not ECMWF NWP-DA Reanalysis
Reconstructing the past more smoothly RMS of differences between observations from radiosondes and short-term forecast (background) Thin line for Northern Hemisphere extratropics Thick line for Southern Hemisphere, typically less well observed ECMWF Operations ERA-Interim ERA-40 1979 1986 1994 2002 2010 ECMWF NWP-DA Reanalysis
Summary of the goals: reanalysis products should be consistent … …in the Vertical …across Atmospheric Parameters …in Time …in the Horizontal ECMWF NWP-DA Reanalysis
Reanalysis course outline ECMWF NWP-DA Reanalysis
background constraint observation constraint simulates the observations The ubiquitous data assimilation slide Observations, with error estimates Background forecast (propagates forward previous information, constrained by dynamical and physical relationships), with error estimates p 4DVAR Analysis Analysis Analysis Analysis Time 00UTC 12UTC 00UTC 25 January 1979 24 January 1979 12-hourly 4D-Var assimilation For eachanalysis, construct a costfunction and findits minimum: This produces the “most probable” atmospheric state ** In a maximum-likelihood sense, which is equivalent to the minimum variance, provided that background and observation errors are Gaussian, unbiased, uncorrelated with each other; all error covariancesare correctly specified; model errors are negligible within the 12-h analysis window ECMWF NWP-DA Reanalysis
Reanalysis componentsPart 1: Observations ECMWF NWP-DA Reanalysis
Evolution of the observing system 1945 US Weather Bureau log(number of observations) D. Dee Satellites Manual stations, limited data exchange First radiosonde networks, systematic soundings International Geophysical Year: radiosonde network enhanced, especially in the Southern Hemisphere First operational satellite soundings (NOAA-2) Improved sounding from polar orbiters; Winds from geostationary orbit; More data from commercial aircraft; First drifting buoys More satellites, aircraft, buoys, ocean gliders and drifters. Fewer radiosondes, but probe higher. Better knowledge of instruments. More obs. per hour. Opport-unity sensors : cell phones, UAVs, vehicles, rooftops, … Upper-air soundings Surface observations Today 2100 1938 1957 1979 1890 1973 ECMWF NWP-DA Reanalysis
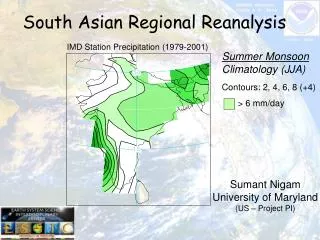
M M A A I I B B C C P P J J D D Q Q K K E E V V H H N N U U Evolution of observation coverage 1958 1979 Ships maintaining fixed locations 2001 S. Uppala 1189 soundings/day 1626 soundings/day 1609 soundings/day ECMWF NWP-DA Reanalysis Radiosonde network Surface pressure network
Increased satellite observation diversity In blue: data that were assimilated in ERA-Interim In grey: data that were not assimilated.…For future reanalyses… Note the timeline starts in 1969 Observation timeline (atmosphere) ECMWF NWP-DA Reanalysis
Improved quality & understanding of observations 39-year time-series (1973-2012) of observation minus reanalysis departures, for an infrared channel near 746 cm-1 Stdev(O-B), without bias correction (K) VTPR - ERA-40 VTPR1, ch.7, 747.65 cm-1 VTPR2, ch.7, 747.55 cm-1 HIRS, ch.6, 748.27 cm-1 AIRS, ch.333 746.01 cm-1 HIRS - ERA-40 HIRS - ERA-Interim AIRS - ERA-Interim ECMWF NWP-DA Reanalysis
Example of improved data coverage, through reprocessing of Meteosat data into Atmospheric Motion Vectors Early 1980s Expanded Low-resolution Winds ECMWF NWP-DA Reanalysis
Reanalysis componentsPart 2: forecast model ECMWF NWP-DA Reanalysis
25 km resolution Illustration of resolution improvements Alps 40 km resolution Orography of the Western Alps(500m contours) Alps 80 km resol. Alps 125 km resol. 125 km resol. Alps ECMWF NWP-DA Reanalysis
Model forcings for reanalysis • Example with ERA-20CM. So far, the previous ECMWF reanalyses did not attempt to use so many “historical forcing” datasets. • ERA-20CM integrates the model, without data assimilation • ERA-20CM uses the following forcings: • HadISST2.1.0.0 sea-surface temperature and ice cover from UK Met Office Hadley Centre • Solar irradiance (CMIP5) • Greenhouse gases (CMIP5) • Ozone for radiation (CMIP5) • Tropospheric aerosols (CMIP5) • Volcanic aerosols (CMIP5) ECMWF NWP-DA Reanalysis
Comparison between “model-only” ERA-20CM and ERA-Interim reanalysis Agung El Chichón Pinatubo ECMWF NWP-DA Reanalysis
Reanalysis componentsPart 3: Data assimilation ECMWF NWP-DA Reanalysis
Ensemble of data assimilations: toward constructing a PDF of the reanalysis Background forecast (propagates forward previous information, constrained by dynamical and physical relationships), with error estimates Background forecast (propagates forward previous information, constrained by dynamical and physical relationships), with error estimates Background forecast (propagates forward previous information, constrained by dynamical and physical relationships), with error estimates Background forecast (propagates forward previous information, constrained by dynamical and physical relationships), with error estimates Background forecast (propagates forward previous information, constrained by dynamical and physical relationships), with error estimates Background forecast (propagates forward previous information, constrained by dynamical and physical relationships), with error estimates Background forecast (propagates forward previous information, constrained by dynamical and physical relationships), with error estimates Background forecast (propagates forward previous information, constrained by dynamical and physical relationships), with error estimates Background forecast (propagates forward previous information, constrained by dynamical and physical relationships), with error estimates Background forecast (propagates forward previous information, constrained by dynamical and physical relationships), with error estimates In ERA-20C p p p p p p p p p p Observations, with error estimates Observations, with error estimates Observations, with error estimates Observations, with error estimates Observations, with error estimates Observations, with error estimates Observations, with error estimates Observations, with error estimates Observations, with error estimates Observations, with error estimates Imperfect measure of uncertainty 4DVAR 4DVAR 4DVAR 4DVAR 4DVAR 4DVAR 4DVAR 4DVAR 4DVAR 4DVAR Analysis Analysis Analysis Analysis Analysis Analysis Analysis Analysis Analysis Analysis Analysis Analysis Analysis Analysis Analysis Analysis Analysis Analysis Analysis Analysis Analysis Analysis Analysis Analysis Analysis Analysis Analysis Analysis Analysis Analysis Analysis Analysis Analysis Analysis Analysis Analysis Analysis Analysis Analysis Analysis Time Time Time Time Time Time Time Time Time Time + 1 day + 1 day + 1 day + 1 day + 1 day + 1 day + 1 day + 1 day + 1 day + 1 day + 2 days + 2 days + 2 days + 2 days + 2 days + 2 days + 2 days + 2 days + 2 days + 2 days + 3 days + 3 days + 3 days + 3 days + 3 days + 3 days + 3 days + 3 days + 3 days + 3 days An ancient date An ancient date An ancient date An ancient date An ancient date An ancient date An ancient date An ancient date An ancient date An ancient date Two-fold benefits: 1. Estimate automatically our background errors, and update them 2. Provide users with uncertainties estimates (not perfect, but still better than … nothing) ECMWF NWP-DA Reanalysis
Background error covariances updated every 10 days, based on past 90 days, for ERA-20C system where surface pressure observation quantity increases by x50 in 100 years From ERA-20C With surface-only observations Horizontal correlation of vorticity background errors Vertical profile of vorticity background error std. dev. With satellites, radiosondes,… (for comparison) ECMWF NWP-DA Reanalysis
Error assumptions:Data assimilation “reality check” For mean-sea level pressure observations, latitudes 20N-90N 1904 2004 For near-surface meridional wind observations, latitudes 20N-90N 1904 2004 ECMWF NWP-DA Reanalysis
Reanalysis course outline ECMWF NWP-DA Reanalysis
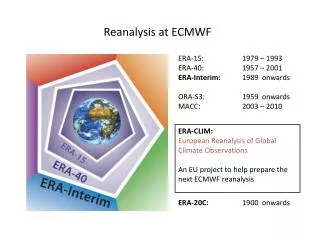
A (short) history of atmospheric reanalysis • 1979: Observation datasets collected for the First GARP Global Atmospheric Research Program Experiment (FGGE): used a posteriori for several years, to initialize models, track progress in NWP. • 1983: Reanalysis concept proposed by Daley for monitoring the impact of forecasting system changes on the accuracy of forecasts • 1988: Concept proposed again, but for climate-change studies, in two separate papers: by Bengtsson and Shukla, and by Trenberth and Olson • 1990s: First-generation comprehensive global reanalysis products (~OI-based) • NASA/DAO (1980 - 1993) from USA • NCEP/NCAR (1948 - present) from USA • ERA-15 (1979 - 1993) from ECMWF – with significant funding from USA • Mid 2000s: Second-generation products (~3DVAR) • JRA-25 (1979 - 2004) from Japan • NCEP/DOE (1979 - present) from USA • ERA-40 (1958 - 2001) from ECMWF – with significant funding from EU FP5 • Today: Third generation of comprehensive global reanalyses (~better than 3DVAR) • NASA/GMAO-MERRA (1979 – present) from USA (IAU) • NCEP-CFSRR (1979 – 2008) from USA (land/ocean/ice coupling) • JRA-55 (1958 – 2012) from Japan (4DVAR) • 20-CR from USA (Ensemble Kalman Filter, surface pressure observations only) • ERA-Interim (1979 – present) from ECMWF (4DVAR) • ERA-20C (1900-2010) from ECMWF (4DVAR ensemble) ECMWF NWP-DA Reanalysis
ERA-SAT Overview of ECMWF atmospheric reanalyses ERA-Interim ERA-40 ERA-15 +Satellites FGGE Observation Diversity +Upper-air ERA-PRESAT +Surface ERA-20C Forcingsonly ERA-20CM 1900 1950 2000 2013/15 ECMWF NWP-DA Reanalysis
How (outside) users exploit reanalysis data How ECMWF users exploit reanalysis data • Baseline to track NWP scoreimprovements • Calibration for seasonal forecasting system • Reference to diagnose changes brought by model improvements • Monitor the observing system • Feedback on observational quality, bias corrections • Basis for homogenization studies of long data records • Develop climate models • Use reanalysis products for verification, diagnosis, calibrating output,, … • Drive users’ models/applications • Use reanalysis as large-scale initial or boundary conditions for smaller-scale models (global→regional; regional→local), in various fields: wind energy, ocean circulation, chemical transport and dispersion, crop yield, health indicators, … • Use climatologies derived from reanalysis for direct applications • Ocean waves, wind and solar power generation, insurance, … • Study short-term atmospheric processes and influences • Process of drying of air entering stratosphere, bird migration, … • Study of longer-term climate variability/trends • Requires caution due to changes in observations input • Lead to major findings in recent years in understanding variability ECMWF NWP-DA Reanalysis
Plate 2.1. Global annual anomaly maps for those variables for which it is possible to create a meaningful 2010 anomaly estimate. Reference base periods differ among variables, but spatial patterns should largely dominate over choices of base period. Dataset sources/names are as follows: lower stratospheric temperature (ERA-Interim); lower tropospheric temperature (ERA-Interim); surface temperature (NOAA/NCDC); cloudiness (PATMOS-x); total column water vapor (AMSR-E over ocean, ground-based GPS over land); surface specific humidity (ERA-Interim); precipitation (RSS over ocean, GHCN (gridded) over land); groundwater 2010–2009 differences (the sum of groundwater, soil water, surface water, snow, and ice, as an equivalent height of water in cm) (GRACE); river discharge absolute values (authors); mean sea level pressure (HadSLP2r); surface wind speed (AMSR-E over ocean, authors in situ over land); ozone (SBUVs/OMI/TOMS/GOME1/SCIAMACHY/GOME2, base period data from the multi-sensor reanalysis, MSR); FAPAR [SeaWiFS (NASA) and MERIS (ESA) sensors]; biomass burning (GFAS). See relevant section text and figures for more details. PLATE 2.1. (a) ERA-Interim 2011 anomalies of MSU Channel 4 equivalent for the lower stratospheric temperature; (b) ERA-Interim 2011 anomalies of MSU Channel 2LT equivalent for the lower tropospheric temperature;(c) NOAA-NCDC 2011 anomalies of surface temperature; (d) ARCLAKE 2011 summer season anomalies of lake surface temperature; (e) PATMOS-x 2011 anomalies of cloudiness; (f) SSMIS (Ocean) and radiosonde and ground-based GPS (circles) (Land) 2011 anomalies map of TCWV anomalies of total column water vapour; (g) ERA-Interim 2011 anomalies of surface specific humidity; (h) ERA-Interim 2011 anomalies of surface relative humidity; (i) RSS and GHCN precipitation; (j) Water Balance Model (WBM) analysis by authors showing 2011 anomalies of river discharge over continents and into oceans; (k) GRACE satellite observations of 2011 minus 2010 annual mean terrestrial water storage (the sum of groundwater, soil water, surface water, snow, and ice, as an equivalent height of water in cm); (l) WACMOS satellite observations of 2011 anomalies of soil moisture; (m) HadSLP2r 2011 anomalies of sea level pressure; (n) Satellite radiometer (ocean) and in situ (land; 1152 sites from ISD-Lite and Tim McVicar) 2011 anomalies of surface wind speed; (o) MACC reana-lysis for 2011 anomalies of total aerosol optical depth; (p) GOME/SCIAMACHY/GOME2 2011 anomalies of stratospheric ozone; (q) MODIS White Sky broadband 2011 anomalies of land surface albedo from the visible spectrum; (r) MODIS White Sky broadband 2011 anomalies of land surface albedo from the near-infrared spectrum; (s) Combined SeaWiFS (NASA) and MERIS (ESA) 2011 anomalies of fraction of absorbed photosynthetically active radiation (FAPAR); (t) MACC GFAS processed MODIS observations for 2011 anomalies of biomass burning in terms of annual carbon emission per unit area. Growing recognition for climate application BAMS State of the Climate in 2008 Plate 2.1. Global annual anomaly maps for those variables for which it was possible to create a meaningful anomaly estimate. Climatologies differ among variables, but spatial patterns should largely dominate over choices of climatology period. Dataset sources and climatologies are given in the form (dataset name/data source, start year–end year) for each variable. See relevant section text and figures for more details. Lower stratospheric temperature (RSS MSU 1981–90); lower tropospheric temperature (UAH MSU 1981–90); surface temperature (NCDC 1961–90); cloud cover (PATMOS-x 1982–2008); total column water vapor (SSM/I/GPS 1997–2008); precipitation (RSS/GHCN 1989–2008); mean sea level pressure (HadSLP2r 1961–90); wind speed (SSM/I1988–2007); total column ozone (annual mean global total ozone anomaly for 2008 from SCIAMACHY. The annual mean anomalies were calculated from 1° × 1.25° gridded monthly data after removing the seasonal mean calculated from GOME (1996–2003) and SCIAMACHY (2003–07)]; vegetation condition [annual FAPAR anomalies relative to Jan 1998 to Dec 2008 from monthly FAPAR products at 0.5° × 0.5° [derived from SeaWiFS (NASA) and MERIS (ESA) data]. BAMS State of the Climate in 2009 Plate 2.1. Global annual anomaly maps for those variables for which it is possible to create a meaningful 2009 anomaly estimate. Climatologies differ among variables, but spatial patterns should largely dominate over choices of climatology period. Dataset sources/names are as follows: lower stratospheric temperature (RSS MSU); lower tropospheric temperature (ERA-interim); surface temperature (NOAA NCDC); cloudiness (PATMOS-x); total column water vapor (SSM/I over ocean, ground based GPS over land); precipitation (RSS over ocean, GHCN (gridded) over land); river discharge (authors); mean sea level pressure (HadSLP2r); wind speed (AMSR-E); ozone (GOME2); FAPAR (SeaWIFS); Biomass Burning (GEMS/MACC). See relevant section text and figures for more details. BAMS State of the Climate in 2010 BAMS State of the Climate in 2011 ECMWF NWP-DA Reanalysis
Time inconsistency exposed:Tropical (20S-20N) stratosphere in ERA-Interim 1979 1990 2000 2011 ~1 hPa (K) Mean analysis increments Model levels (K) Sfc. JRA-25 ERA-40 (K) Mean analyses at 1hPa ERA-Interim ECMWF NWP-DA Reanalysis
Reanalysis course outline ECMWF NWP-DA Reanalysis
Summary of important concepts • Reanalysis does not produce “gridded observations” • But it enables to extract information from observations in one, unique, theoretically consistent framework • Reanalysis sits at the end of the (long) meteorological research and development chain that encompasses • observation and measurement collection, • observation processing and data exchange, • numerical weather prediction modelling and data assimilation • Unlike NWP, a very important concern in reanalysis is the consistency in time, over several years • Reanalysis is bridging slowly, but surely, the gap between the “weather datasets” and the “climate datasets” • Resolution gets finer • Reanalyses cover longer time periods, without gap • Helps different communities work together • Reanalysis has developed into a powerful tool for many users and applications ECMWF NWP-DA Reanalysis
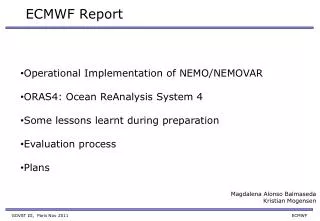
Current status of global reanalysis& Future outlook ERA-20C ERA-CLIM2 • It is worth repeating as all ingredients continue to evolve: • Models are improving • Data assimilation methods are improving • Observation (re-)processing is improving • Old observations (paper records) are being rescued • The technical infrastructure for running & monitoring improves constantly • With each new reanalysis we improve our understanding of systematic errors in the various components of the observing system • Major challenges for a future comprehensive reanalysis project: • Bringing in additional observations (not dealt with in ERA-Interim) • Dealing with changing background quality over time • Dealing with model bias, tied to problems with trends interpretation • Coupling with ocean and land surface • Making observations used in reanalysis more accessible to users • Providing meaningful uncertainty estimates for the reanalysis products ECMWF NWP-DA Reanalysis
Differences with “model-only” gridded datasets Model-only datasets are the “model limit” of reanalyses. They are extremely important for improving understanding. Summarize here the differences with reanalyses… You can use slidenumber 6 as a starting point. ECMWF NWP-DA Reanalysis
Further reading and on-line material Kalnay et al. (1996), “The NCEP/NCAR 40-Year Reanalysis Project”, Bull. Am. Meteorol. Soc.77 (3), 437-471 Uppala et al. (2005), “The ERA-40 reanalysis”, Q. J. R. Meteorol. Soc.131 (612), 2961-3012, doi:10.1256/qj.04.176 Bengtsson et al. (2007), “The need for a dynamical climate reanalysis”, Bull. Am. Meteor. Soc.88 (4), 495-501 SciDAC Review (2008), “Bridging the gap between weather and climate”, on the web at http://www.scidacreview.org/0801/pdf/climate.pdf with contributions from G. P. Compo and J. S. Whitaker European reanalysis (ERA): http://www.ecmwf.int/research/era NCEP/NCAR reanalysis: http://www.cdc.noaa.gov/data/reanalysis/reanalysis.shtml NCEP CFSR: http://cfs.ncep.noaa.gov/cfsr/ Japanese 25-year reanalysis (JRA-25): http://jra.kishou.go.jp NASA GMAO Modern Era Retrospective-analysis for Research and Applications (MERRA) http://gmao.gsfc.nasa.gov/research/merra/ Dee et al. (2011), “The ERA-Interim reanalysis: configuration and performance of the data assimilation system ”, Q. J. R. Meteorol. Soc., 137 (656), 553-597 ECMWF NWP-DA Reanalysis
ERA-Interim data availability and access • From January 1979 until present, with monthly updates (2-3 month delay) • Resolution: T255L60, 6-hourly upper-air fields, 3-hourly surface fields • Analysis + forecast products; monthly averages • Access to products: • Member state users: MARS: full access • All users: ECMWF Public Data Server: http://apps.ecmwf.int/datasets/data/interim_full_daily/ ECMWF NWP-DA Reanalysis