Download
1 / 30
300 likes | 456 Views
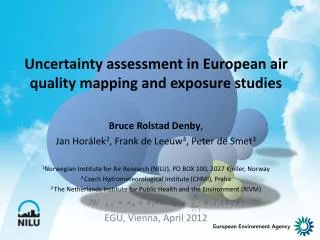
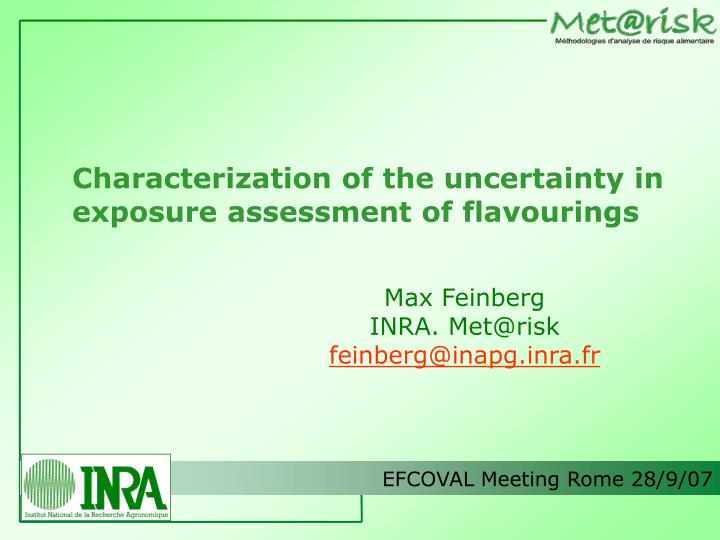
Characterization of the uncertainty in exposure assessment of flavourings. Max Feinberg INRA. Met@risk feinberg@inapg.inra.fr. 1. Exposures. =. a i. . A. . 1. Foods. Contents q j. Weights p i. Consumptions. . Consumers. c ij. I : individuals J : foods.

E N D
Characterization of the uncertainty in exposure assessment of flavourings Max FeinbergINRA. Met@riskfeinberg@inapg.inra.fr
1 Exposures = ai A 1 Foods Contents qj Weights pi Consumptions Consumers cij I : individuals J : foods General method to calculate exposure
Individualconsumptionscij Weights pi Householdconsumptionsmkj Direct methods Purchasing panels Degradation of precision I : individualsK :householdsJ : foods 1 Food production statistics National budget Dimension “reduction”
Maximized Survey derived Daily Intake or Per-Capita Times Ten (PCTT) • Correction factors • Annual production volume is corrected by 60%. • 10% population are consumers. Flavour production volume v Correctionfactors = MSDI Consumerspopulation p MSDI
Theoretical Added Maximum Daily Intake • “Maximal” Concentration. Upper Use Level (UUL) • Consumer consumes a fixed amount of flavoured food and beverages that contains the flavouring at its specified level. Max. levels (UUL) Foods = TAMDI Consumptions TAMDI
Possible Average Daily Intake • (“Typical” concentration of the flavour agent within specific food categories) (Daily mean consumption of those food categories). Median values ? • Proposed by Flavour and Extract Manufacturers’ Association (FEMA, USA). “Typical” conc. Foods = PADI Consumptions PADI
Probabilisticevaluation Knowledge ofconsumption Bestestimate Individualrecords Householdsurveys Pointestimates Nationalsurveys TAMDI MSDI PADI First estimate Productiondata Knowledge ofcomposition Regulatoryvalues Imputed contents Analysed contents Ranking exposure estimates
Uncertainty and variability A proposal to assess exposure estimate quality
Uncertainty (of measurement): parameter, associated with the result of a measurement, that characterises the dispersion of the values that could reasonably be attributed to the measurand. • Measurand: specific quantity subject to measurement. What is uncertainty?
Milieu Manpower Method Material Instrument Accommodation and environmental conditions 5.3 Calibration, method and validation 5.4 Personnel5.2 Result +Uncertainty Traceability5.6 Samples andcalibrants handling5.8 Equipment5.5 Sampling5.7 ISO 17025, §5. Technical requirements Uncertainty for analytical measurement
Milieu Manpower Instrument Material Method Sampledpopulation Instrument Interviewer Traceability Expertise Consumption +Uncertainty Amount Ability to recall Naming Characteristics Food Consumer Uncertainty sources for dietary recalls
Existence of consumption systems inside dietary patterns. Consumptionsystem Dietaryrecord Variability = + Individual + Uncertainty A more complex model
Estimation of uncertainty Two approaches
T Bias B Z L1 Labo1 Repeatability srInter-labs sLReproducibility L2 Labo 2 L3 Labo 3 Type A. Inter-lab analysis
Reproducibility U(Z) = 2 sR U(Z) = 2 sr repeatability Example of an inter-laboratory analysis
35 sR 30 25 20 15 10 5 C g/100g 0 0 10 20 30 40 50 60 Reproducibility and concentration (sugars)
100.00 sR sR = 0.005 C 0.649 10.00 1.00 sRLim = 0.04 C 0.849Horwitz model 0.10 0.01 0 1 10 100 C kg/kg Horwitz’s model
Z = f (X1, X2, X3,...). • Z : reported result. • Xi : intermediate results, quantities involved in uncertainty, etc... • f : represents the measuring process but does express a physical law. • Z, X1, X2, X3,... random variables. Type B. Variance propagation theorem
= + - Z X X X 1 2 3 = + + 2 2 2 u ( Z ) u ( X ) u ( X ) u ( X ) 1 2 3 c × X X = 1 2 Z X 3 2 2 2 æ ö æ ö æ ö u ( Z ) u ( X ) u ( X ) u ( X ) ç ÷ ç ÷ ç ÷ = + + 3 c 1 2 ç ÷ ç ÷ ç ÷ Z X X X è ø è ø è ø 1 2 3 • Linear combination. • Products and/or ratios combination. Simplifications
Flavouring categories (Directive 88/388). • Natural, natural-identical or artificial flavouring substances, flavouring preparations of plant or animal origin, process flavourings, smoke flavourings. • Flavouring substance is obtained : • by appropriate physical … or enzymatic or microbiological processes, from material of vegetable or animal origin … • by chemical synthesis or isolated by chemical processes (chemically identical)… • by chemical synthesis (not chemically identical). Extended chemical definition
2-methyl butyric acid • S-enantiomer pleasant, sweet, and elegant with a fruity note. • R-enantiomer penetrating, cheesy and sweat-like Biological activity and chirality
Hyphenated mass spectrometry coupled to chromatography. • GC-MS (quadrupole). • GC-MSn (ion trap). • LC- MSn (ion trap or TOF). • Near infrared spectroscopy. • GC-FTIR. • High resolution NMR spectrometry. • Sensory analysis coupled to GC. Sophisticated analytical techniques
Flavourings • Urgent needs for “in-food” measured data. • Develop analytical methods (standardization). • Better define some molecules. • Better relate tolerance and le risk. • Food consumption • Needs for harmonisation of dietary records. • Identification of bias and define traceability. • A proposal: uncertainty to organise harmonisation. • Develop methods to assess digestibility. • A new discipline: “Consumetrics” ? Conclusions
Trueness Accuracy Error Precision True value + Trueness and precision