Download
1 / 27
270 likes | 404 Views
Climate Change and Creating a Sustainable Future for Guildford Guildford Environmental Forum - 30 th June 2010. Professor Roland Clift Centre for Environmental Strategy University of Surrey President of the International Society for Industrial Ecology. THE IPAT RELATIONSHIP. EHRLICH.

E N D
Climate Change and Creating a Sustainable Future for Guildford Guildford Environmental Forum - 30th June 2010 Professor Roland Clift Centre for Environmental Strategy University of Surrey President of the International Society for Industrial Ecology
THE IPAT RELATIONSHIP EHRLICH I - human impact on the environment P - population A - affluence (interpreted as level of resource consumption per capita) T - technology (the way in which wealth, in the material sense, is created) I = P x A x T (Source: P. Ehrlich and J. Holdren (1971) “Impacts of population growth” Science 171, pp. 1212-1217
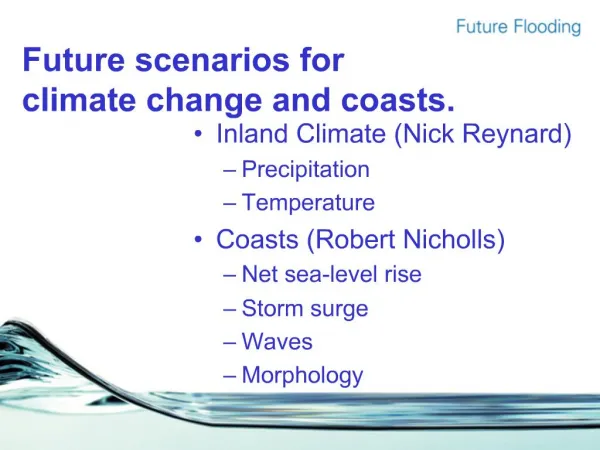
CARBON DIOXIDE CONCENTRATION AND TEMPERATURE: EVIDENCE FROM ICE CORES
PER-CAPITA CO2 EMISSIONS, 1996 (Tonnes) “Contract & Converge” 3.6
CARBON CYCLES Renewable: carbon removed from atmosphere by growing plants and trees, by photosynthesis; may be subsequently returned to atmosphere Non-renewable: carbon dioxide released by burning fossil fuels CAUTION: The biosphere cannot sequester the lithosphere...
ENERGY USE DIRECT: transport, heating, appliances INDIRECT: “embodied” in what we consume
4% 28% Public Sector Business 40% Transport (including freight) Residential 29% Carbon dioxide emissions by end user in the UK, 2004
Residential carbon dioxide emissions, 2003: 5% 20% Cooking Space heating Lights and appliances 22% 53% Water heating
STEP 1. • Insulate your home • Use low-carbon heat supply..? • Use low-energy devices and lighting • Switch things off
MODES OF PASSENGER TRANSPORT(N.B. Rough indicative figures only!) Per passenger: 1km by air is equivalent to 1km in a car shared with 1 other person is equivalent to 10km in a high speed train
MODES OF FREIGHT TRANSPORT(N.B. Rough indicative figures only!) Per tonne of freight: 1km by air is equivalent to: 20 to 100 km by rail is equivalent to: 200 km by ship RCEP, 2002 : “..air freight is so much more environmentally damaging…that it must be regarded as a particular luxury reserved for very high value, and usually perishable goods.”
RCEP, 2002 “…… air freight is so much more environmentally damaging… that it must be regarded as a particular luxury for very high value…and usually perishable goods”.
DIRECT AND INDIRECT GHG EMISSIONS CO2 emissions allocated to high level functional uses for an average UK household (2004) Commuting, 9% Communications, 1% Space heating, 15% Education, 2% Household, 12% Recreation & Leisure, 26% Food & catering, 15% Health & Hygiene, 8% Clothing & footwear, 11% Reference Druckman, A. and T. Jackson (2009). “The carbon footprint of UK households 1990-2004: a socio-economically disaggregated, quasi-multiregional input-output model.” Ecological Economics (in press).
FIRST USE Manufacturing Distribution Use Material and Energy Extraction Waste Management EARTH
ACCUMULATION OF ECONOMIC VALUE AND ENVIRONMENTAL IMPACT ALONG THE SUPPLY CHAIN – MANUFACTURED PRODUCTS ENVIRONMENTAL IMPACT 4 3 2 1 0 1: Resource extraction 2: Processing & Refining 3: Manufacturing 4: Retail and distribution ADDED VALUE or CONTRIBUTION TO GDP
Stylized representation of the distinction between “absolute” and “relative” decoupling Source: UNEP Decoupling assessment report (Zero draft, 19 May 2009)
Achieving decoupling in the Netherlands: 1985-2010 Source: Netherlands Environmental Assessment Agency and National Institute for Public Health and the Environment 2005
SECTOR: “WEARING APPAREL” (Reproduced from Hogne Nersund Larsen, 2007) Notes: • Zeroth tier corresponds to manufacturing the garment; 1st tier corresponds to inputs to zeroth tier etc. • Shaded area shows range of all sectors for both UK and China. “…there are only a few…sectors with higher convexity than UK production of wearing apparel”.
Where does this point? A redefinition of quality or luxury… EQUITY includes: • Equity along the supply chain • Equity of access to “environmental services” between affluent and poor This requires consumption in affluent societies to have low environmental impact per dollar spent and to provide social and economic benefits along the supply chain: The “Fair Trade” principle and beyond…
LOOK AT SOURCING OF FOODS - “Food Miles” are irrelevant: - how was it transported - avoid anything transported by air freight - Read the “carbon footprint” - It can differ widely between different sources - Favour local, seasonal produce
Gucci is good for the earth and Angels wear Prada
Multiple points for interference in the GH Effect Source: NASA