Download
1 / 37
370 likes | 373 Views
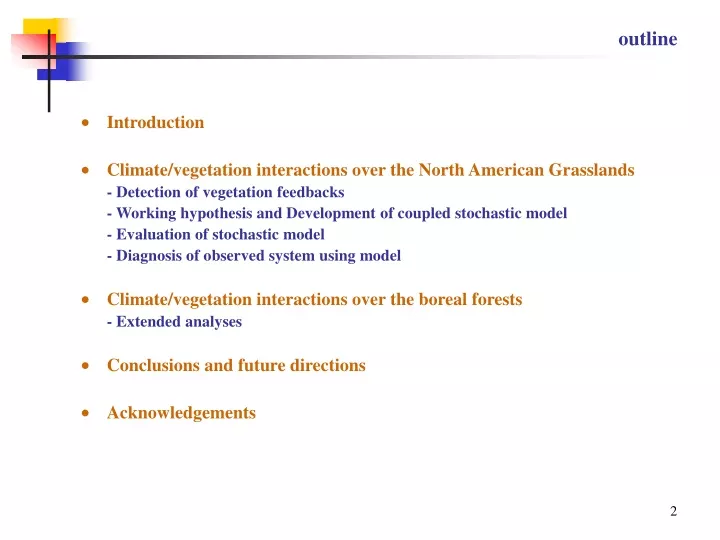
outline. Introduction Climate/vegetation interactions over the North American Grasslands - Detection of vegetation feedbacks - Working hypothesis and Development of coupled stochastic model - Evaluation of stochastic model - Diagnosis of observed system using model

E N D
outline • Introduction • Climate/vegetation interactions over the North American Grasslands - Detection of vegetation feedbacks - Working hypothesis and Development of coupled stochastic model - Evaluation of stochastic model - Diagnosis of observed system using model • Climate/vegetation interactions over the boreal forests - Extended analyses • Conclusions and future directions • Acknowledgements
background Satellite monitoring of global vegetation activity provides valuable datasets for studying large-scale vegetation dynamics and their connection with climate variations. Satellite datasets indicate that half of the vegetated lands greened since the early 1980s, mainly due to changes in climatic constraints to plant growth. FromThe Greening Earth (http://cybele.bu.edu/greeningearth/ge.html)
motivation Terrestrial vegetation plays an important role in – the global radiation balance, – the hydrological cycle, – carbon and nutrient cycles, – momentum transfer (wind) between the surface and the atmosphere. Changes in vegetation can affect the variability of climate. Can we identify the influence of vegetation on climate variability from observational datasets?
Temperature Precipitation Observation Vegetation Diagnosis The “True” Climate-Vegetation System (http://www.atmos.berkeley.edu/ids/SiB2) problem formulation The Empirical Reconstruction This problem requires constructing an empirical system that simulates the dynamic relationships among the observed temperature, precipitation, and vegetation variations.
(1) basic approach We presume that interactions between vegetation/climateanomaliescan be approximated asa linear system with constant coefficients. Example: Simulating Precipitation Variability Are lagged V’s necessary in Eq. (1)? Can Eq. (1) be derived theoretically? What may be the physical foundations for Eq. (1)? How are they related to current P? Can it improve our understanding of the system? Modeling Detection Physical Hypothesis
datasets and compilations • Domain: North American Grasslands and boreal forests between 40oN – 75oN; • Datasets: NOAA AVHRR NDVI (vegetation), NASA GISS surface temperature, NOAA CMAP precipitation, and CPC US UNIFIED precipitation; • Anomalies: monthly anomalies of climate/vegetation variables are calculated relative to their 1982–2000 climatologies, respectively;
Detecting vegetation feedbacks over the North American Grasslands
(1) (2) (3) Granger causality Do vegetation anomalies “cause” future variations in climate? Option 1: Yes, vegetation information is important. Option 2: No, vegetation does not matter. Decision: How is Option 2 different from Option 1 in terms of prediction errors? Granger causality: Vegetation is said to “Granger cause” climate variability if it contains unique information about future variations of temperature/precipitation.
Mean vegetation anomalies • Trends of vegetation anomalies results of causal analysis Higher mean NDVI anomalies => lower rainfall higher temperature Decreasing trends of NDVI anomalies => lower rainfall higher temperature How do we understand these statistical causal relationships?
intraseasonal oscillation • Considering both climate forcing and vegetation feedbacks: Higher V Lower PV decreases V increasesHigher P Lower V These coupled relationships suggest oscillatory variability of the system !
intraseasonal oscillation (2) • Oscillatory variations identified in observations (continued) wet Monthly NDVI anomalies and seasonal precipitation anomalies averaged over the domain drought “Wet-year” composite of monthly NDVI anomalies and monthly precipitation anomalies
Modeling vegetation feedbacks over the North American Grasslands
Working Hypothesis • In an arid environment, soil water surplus promotes vegetation growth; • Enhanced vegetation will extract more water from the soil, and thereby deplete soil moisture faster than normal; • The drier soil in turn decreases the water flux (as well as latent heat) to the atmosphere, which leads to lower rainfall and higher surface temperatures; • The drier soil also forces vegetation to decrease and drives the coupled system to develop in the opposite direction.
model derivation Three important components of the proposed physical mechanism Vegetation Dynamics Soil Water Balance Soil Moisture/Precipitation Coupling * Detailed derivations can be found in Wang et al. (2006b)
model derivation (2) • Model representation involves only precipitation and vegetation Climate Forcing: Vegetation Feedback: – This is a pair of linear equations with two lagged vegetation terms; – The physical meanings of the constant coefficients can be interpreted in terms of system parameters;
Evaluation of Stochastic Model Does the model capture the observed vegetation/precipitation covariability?
open-loop model • Simulating NDVI variations using observed precipitation anomalies
open-loop model (2) • Frequency responses of NDVI to precipitation: model and observations
closed-loop model • Power spectra of precipitation: observations and simulations Observation Simulation Vegetation feedbacks during the growing season may represent an important source for the “red” spectra of the observed precipitation anomalies
closed-loop model (2) • Oscillatory variability of precipitation: Monte-Carlo experiments The autocorrelations of precipitation become slightly negative at time lags of 3-5 months when vegetation feedbacks are incorporated. The negative lagged cross-correlations indicate higher vegetation anomalies often precede lower precipitation. The coupled model captures the covariability of the precipitation-vegetation system as identified in the observations.
Diagnosis Using Stochastic Model Why would the observed climate-vegetation system be oscillatory?
theoretical analysis • Intrinsic variability: a simple experiment The impulse-responses of NDVI to precipitation
The decaying time constant is about 2.3 month The intrinsic oscillation period is about 8.25 months. theoretical analysis (2) • Analytical solution Internal Structure External Forcing
theoretical analysis (3) • Oscillation Domain Current System The system is likely to be oscillatory when – β/γ is high, i.e., vegetation production is fast; – α is high, i.e., vegetation anomalies are persistent.
theoretical analysis (4) • Why would the system have higher αor higherβ/γ? Long-term equilibrium of the system A higher β/γ (faster production) and/or a higher α (longer persistence) can increase the long-term growth of vegetation for a given precipitation input.
theoretical analysis (4) • Why would the system have higher αor higherβ/γ(continued)? The step-responses of vegetation: (a) α, β; (b) α, β/2; (c) α/2, β The oscillatory variability of the system may reflect vegetation’s interactions with soil moisture to maximize its long-term growth.
generalized approach Can we use a pair of linear equations to describe climate/vegetation interactions over other climate regimes? Climate Forcing: Vegetation Feedback:
Oscillation Period (month) (a) A1and (b) A2 , multiplied by the standard deviation of NDVI anomalies at each grid point intrinsic variability of vegetation Climate Forcing: Intraseasonal oscillation may be a general characteristic of vegetation variability that is independent of biome types.
vegetation feedback Vegetation Feedback: B1 B2 p-level
physical interpretations An analogy between vegetation/temperature interactions (surface energy balance) and vegetation/precipitation interactions (soil water balance) Vegetation Dynamics Surface Energy Balance Land Thermal Lag
Forest Grassland 5-month Period 6-month Period 8-month Period Physical Interpretations Analogy between grasslands and boreal forests (continued) Interactions between vegetation and the surrounding environment produce oscillatory intraseasonal variability to achieve maximum long-term production.
Conclusions • This study diagnoses and evaluates large-scale climate/vegetation interactions from observed temperature, precipitation, and vegetation datasets; • It detects statistical causal relationships from vegetation anomalies to summertime climate variability over both the midlatitude grasslands and boreal forests; • It identifies intrinsic oscillatory variability of the climate-vegetation system; • These statistical results highlight physical mechanisms in which vegetation plays an important role in regulating the balance of water (grasslands) or energy (forests) between the surface and the atmosphere; • It also develops a stochastic model to verify the proposed physical mechanisms.
Contributions of Research • Observational evidence for large-scale vegetation feedbacks on climate variability; • Better understanding of climate/vegetation interactions at intraseasonal time scales • A set of methodologies to diagnose interactions within the coupled climate-vegetation system;
Future Directions • Further verification using improved satellite data; • Process-based investigation with in situ measurements; • Examination of remote vs. local climate impacts/responses; • Refinement of simple theoretical models for two-species ecotones; • Investigation of relation between asymmetric intraseasonal and interannual interactions across similar ecosystems.
Acknowledgements I would like to express my gratitude to my PhD-committee members (Drs. Bruce T. Anderson, Ranga B. Myneni, Nathan Phillips, Robert K. Kaufmann, and Dara Entekhabi) for their guidance, support, and encouragement during the course of this dissertation. My thanks also go to all the faculty, staff, and graduate students of the Department of Geography and Environment. Thank You!