Download
1 / 26
260 likes | 402 Views
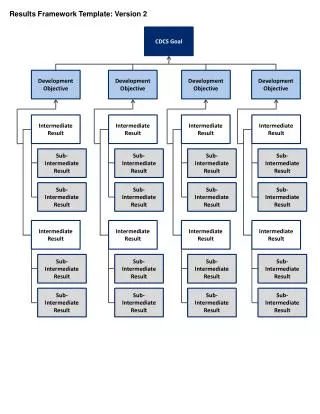
CDCs/SPCs & EVAAS. July 25, 2013 Greensboro, NC. What is Your Role? ( polleverywhere ). Goals. Understand how to navigate EVAAS. Understand the premise of Value-Added Models. Understand 6 EVAAS reports and have ideas on how you might use them.

E N D
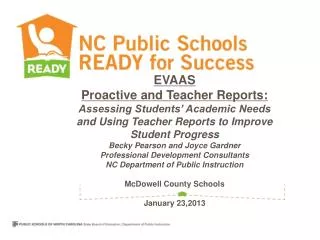
CDCs/SPCs & EVAAS July 25, 2013 Greensboro, NC
Goals • Understand how to navigate EVAAS. • Understand the premise of Value-Added Models. • Understand 6 EVAAS reports and have ideas on how you might use them. • Apply ideas to scenarios of CTE teachers and students.
EVAAS can tell you WHAT happened. It’s up to YOU to determine WHY it happened and what you want to do about it.
Navigating the Site • Tabs • Subgroups (must have 5) • Help
http://ncdpi.sas.com SAS EVAAS Questions? • Sandy.Horn@sas.com
Effectiveness Categories Growth = 4 / Standard Error = 1 Index = 4 Growth = 4 / Standard Error = 2 Index = 2 State Growth Standard/State Average = 0.0 Standard Error = a measure of uncertainty Usually, the more data you have, the smaller the standard error. Index = Teacher Estimate divided by its Standard Error Index is 2 or higher Index is equal to or greater than a -2 but less than +2 0.0 Index is less than -2
How could use the Student Report? • (Text responses using PollEverywhere)
Report 2: Projection Report EOC, ACT, SAT, AP Projections are available.
Brainstorm ideas for using projection reports for math, ELA, ACT in CTE • Text responses using PollEverywhere
Report 3: Student Pattern Report • Check the boxes of the students you would like to select. • EVAAS will divide students into low, middle and high providing the average growth for each subgroup. • Ideas for using this report: • CDC/SPC might use to run reports on students receiving targeted services. (Must be at least 15 students) • IMC might run a report for concentrators as well as for clusters. • Teachers can use to examine their impact on students. (see next slide for an example)
Use Student Pattern Report Copied to Excel for Reflection on Growth
Student Teacher Linkages(from View List of Students on previous slide)
EVAAS Teacher Value Added Report Supplemental Information Table
Exit Poll Text responses: How do you think CDCs and SPCs can most effectively use EVAAS?