Download
1 / 42
420 likes | 719 Views
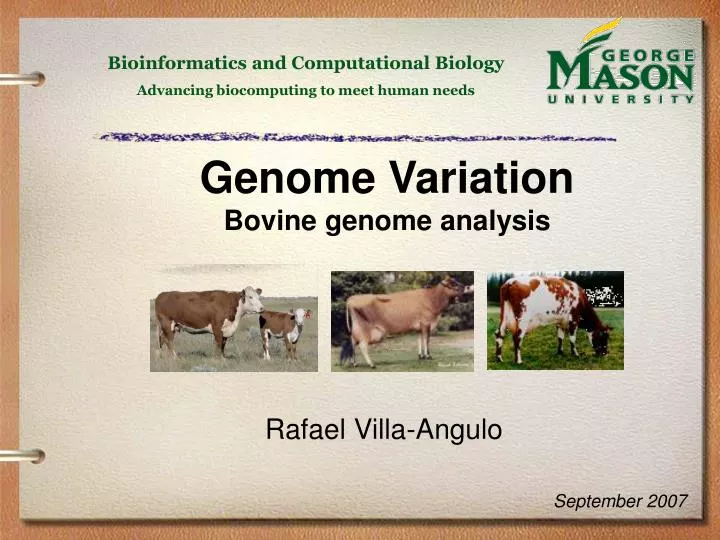
Bioinformatics and Computational Biology Advancing biocomputing to meet human needs. Genome Variation Bovine genome analysis. Rafael Villa-Angulo. September 2007. Bovine HapMap. Basic concepts Bovine HapMap data Haplotype analysis Allele sharing Population structure. 1. Basic concepts.

E N D
Bioinformatics and Computational Biology Advancing biocomputing to meet human needs Genome VariationBovine genome analysis Rafael Villa-Angulo September 2007
Bovine HapMap • Basic concepts • Bovine HapMap data • Haplotype analysis • Allele sharing • Population structure
1. Basic concepts In diploid organisms (such humans and chimps) there are two (not completely identical) "copies" of each chromosome, and hence of each region of interest. A description of the data from a single copy is called haplotype, while a description of the conflated (mixed) data on the two copies is called genotype (Gusfield 2002). The specific physical appearance and constitution or the specific manifestation of a trait is called phenotype.
1. Basic concepts (cont) Fig 2 Haplotype analysis to identify DNA variations associated to a disease
1. Haplotyping process The haplotype Phasing problem can be defined as follows: Problem: Haplotype Phasing (generic) Input: A set of G genotypes. Output: A set of H haplotypes, such that for each gi G there exists hi , hi’ H such that the conflation of hi with hi’ is gi.
1. Haplotyping process • The solution to the haplotype Phasing problem is not straightforward due to resolution ambiguity • Computational and statistical algorithms for addressing ambiguity in Haplotype Phasing: 1) parsimony 2) phylogeny 3) maximum-likelihood 4) Bayesian inference
2 Bovine HapMap data • The bovine HapMap will be a catalog of common genetic variants that occur in cattle. • It will describe what these variants are, where they occur in chromosome regions, and how are they distributed among individuals within populations and among populations in different breeds.
2. Bovine HapMap data (cont) • Grouping bovine breeds: Bovine Bos Indicus Bos Taurus African Composite Beef breeds: Charolais Limousin Piedmontese Romagnola Hereford Angus Red Angus Dairy breeds: Brown Swiss Guernsay Holstein Jersey Norwegian Red Gir Nelore Brahman Sheko N’Dama Beefmaster Santa Gertrudis
2. Bovine HapMap data (cont) • A total of 501 animals were genotyped representing 21 cattle breeds. • The breeds included a combination of Bos Taurus, Bos indicus and composites from several continents.
2. Bovine HapMap data (cont) Table 1. Initial number of animals per breed in the HapMap data
2. Bovine HapMap data (cont) Table 2. Initial number of markers per chromosome in the HapMap data
2. Bovine HapMap data (cont) • Cleaning the dataset Missing data - Animals with genotype completeness <89% were removed (normalized to the more complete individual). - markers removed due to greater than 10% missing data > 50% of Taurus and >50% Indicus. HWE test and genotyping error - Markers removed due to estimated genotyping error rate > 5% and at list one breed out of HWE.
2. Bovine HapMap data (cont) Minor Allele Frequency - Markers removedfor being monomorphic in all breeds. - Markers removed due to MAF<0.05 in all breeds. Discordance - Markers were removed due to having >2 discordant trios. Unassigned chromosomes - Markers assigned to unknown chromosomes were removed
2. Bovine HapMap data (cont) Summary The final dataset contains 29,394 markers from 487 animals.
3. Haplotype analysis • Haplotypes inference A pair of haplotypes were estimated for animals in each breed using fastPHASE, a Maximum-Likelihood based method (Sheet and Stephens 2006)
3. Haplotype analysis (cont) • Results: - 570 files containing inferred haplotypes * 487 individuals * 30 chromosomes per individual * 2 haplotypes per chromosome
3. Haplotype analysis (cont) • Genetic variation in genomes is organized in haplotype blocks. (Guryev, et, al., 2006 ) • Haplotype maps characterize the common patterns of linkage disequilibrium in populations. • Haplotype blocks provide substantial statistical power in association studies of common genetic variation across regions (Gabriel, et. al., 2002)
3. Haplotype analysis (cont) • Block definition: Blocks based on pairwise and grouped r2 values. (i) Begin a block by selecting the pair of adjacent SNPs with the highest r2 value (no less than = 0.4); (ii) repeatedly extend the block if the average r2 value between an adjacent marker and the current block members is above (=0.3)and all the individual r2 values are above (=0.1).
3. Haplotype analysis (cont) Table 3 Average values of block statistics
3. Haplotype analysis (cont) Figure 23 LD assessment for all SNPs inside blocks
3. Haplotype analysis (cont) Figure 25 LD assessment for all SNPs inside blocks
3. Haplotype analysis (cont) • Consistency of block boundaries across breeds 1. adjacent pairs of SNPs with intermarker distances up to 10 kb were examined, 2. If the SNPs pair is assigned to a single block, count it as concordant (no evidence of historical recombination), 3. If the SNPs pair is not assigned to a single block, count it as discordant (evidence of recombination) (Gabriel et al, 2002)
3. Haplotype analysis (cont) (a) (b) (c) Figure 26 Concordance and discordance assignments for SNP pairs within distance < 10 kb for Angus vs Holstein breeds.
3. Haplotype analysis (cont) Figure 28 Dendogram based on haplotype boundary discordances in chromosome 14
3. Haplotype analysis (cont) Figure 32 Breeds sorted by PC1 derived from haplotype block vectors on chromosomes 6, 14, and 27
4. Population structure 4.1 MAF and nucleotide diversity 4.2 Linkage Disequilibrium 4.3 Genetic differentiation
4. Population structure (cont) MAF (all breeds polymorphic proportion graphs)
4. Population structure (cont) Figure 6 Breeds sorted by PC1 derived from minro allele frequencies on chromosomes 6, 14,and 25
4. Population structure (cont) Linkage Disequilibrium Analysis Figure 8 r2 plot for chromosome 6 in Angus breed using all markers passing a X2 test.
4. Population structure (cont) Genetic differentiation Figure 11 Genetic differentiation (FST) by marker in chromosome 6 between Beef and Dairy breeds
4. Population structure (cont) Figure 14 Genetic differentiation (FST) by marker in chromosome 6 between Bos Taurus and Bos Indicus clusters
5. Allele sharing analysis • Multi-marker allele sharing on chromosomes with dense markers (6, 14, 25) • Allele defined as the haplotypes observed within a sliding window containing w = 10 adjacent markers spanning no more than 200 kb • Each window containing 10 markers and spanning no more than 200 kb defines a single “locus” • Loci may overlap
5. Allele sharing analysis (cont) • Proportion of shared alleles between two populations P1 and P2at locus k: Where i and j range over the individuals in populations P1 and P2 , respectively.Sa(i, j, k) is the number of shared alleles between individuals i and j at locus k, and n1 and n2are the number of samples in P1 and P2.
Allele sharing analysis (cont) • Normalized proportion of shared alleles: • S’(P1 ,P2 ,k) = 1.0 when the proportional of sharedalleles between P1 and P2 equals the average of the proportional of shared alleles within P1 and P2 . • S’(P1 ,P2 ,k) << 1.0 when the proportion of shared alleles between the two populations is much less than the average within the two populations.
Allele sharing analysis (cont) Figure 17 Normalized proportion of shared multi-marker alleles between Angus and Holstein on a region of chromosome 6
Allele sharing analysis (cont) • Clustering Breeds Based on shared alleles The proportion of shared alleles can be used as a distance measure for clustering breeds. • Normalized distance between P1 and P1: where u is the number of loci with shared alleles • D’(P1 ,P2) = 0 if breeds P1 and P2share the same proportion of alleles as are shared by individuals within each individual breed.
Allele sharing analysis (cont) Figure 20 Dendogram based on shared alleles on chromosome 6.
Preliminary conclusions • High differentiation regions between breed and breed clusters were identified from Fst Analysis • PCA analysis on MAF and block boundary discordances permits us to cluster breed in the geographical and ancestry groups • Proportion of shared alleles between breeds exhibits considerable variation that is significantly auto-correlated, indicating possible effects of selection
Future Directions • Improved haplotype algorithms for Bovine data sets • Comparison of Haplotype Inference Algorithms • Further analysis of Bovine Genome variation
Collaborators Dr. John Grefenstette Dept. of Bioinformatics and Computational Biology, GMU Dr. Lakshmi Kumar Dept. of Bioinformatics and Computational Biology, GMU USDA Dr. Clare Gill and Jungwoo Choi (PhD student) Dept. of Animal Science, Texas A & M University
Bibliography L. Hartl Daniel. (2000) A Primer of Population genetics.Third edition. Sinauer Associates, Inc. Gusfield, Dan (2002). An Overview of Combinatorial Methods for Haplotype Inference. Computational Methods for SNPs and Halpotype Inference. Springer. LNBI 2983. Scheet P., Stepehens M. (2006) A fast and flexible statistical model for large-scale population genotype data: applications to inferring missing genotypes and haplotypic phase. Am J Human Genetics 78(4): 629-644. Gibson G., Muse V. Spencer. (2004) A Primer of Genome Science. Second Edition. Sinauer Associates, Inc. Wright S (1951) The genetical structure of population. Annals of Eugenics, 15: 323-354. Wright S (1965) The interpretation of population structure by F-statistics with special regard to systems of mating. Evolution., 19: 395-420.
Bibliography (cont) Wright S (1978) Evolution and genetics of populations. Vol. 4. Variability Within and Among Natural Populations. Univ. of Chicago Press, Chicago. Michlataos-Beloin,S., Tishkoff,S.A., Bentley, K.L., Kidd,K.K. and Ruano,G.(1996) Molecular haplotyping of genetic markers 10kb apart by allelic-specific long-range PCR. Nucleic Acids Res., 24, 4841-4843. Douglas,J.A., Boehnke,M., Gillanders,E., Trent,J.M. and Gruber,S.B. (2001) Experimentally derived haplotypes substantially increase the efficiency of linkage disequilibrium studies. Nat. Genet., 28, 361-364. Bowcock, A. M., Ruiz-Linares, A., Tomfohrde, J., Minch, E., Kidd, J. R. & Cavalli-Sforza, L. L. (1994) High resolution of human evolutionary trees with polymorphic microsatellites. Nature368, 455-457. Felsenstein, J. 1989. PHYLIP - Phylogeny Inference Package (Version 3.2). Cladistics5: 164-166. Mountain, J. L. & Cavalli-Sforza, L. L. (1997) Multilocus genotypes, a tree of individuals, and human evolutionary history. American Journal of Human Genetics61, 705-718. Witherspoon, D. J., Wooding, S., Rogers, A. R., Marchani, E. E., Watkins, W. S., Batzer, M. A. & Jorde, L. B. (2007) Genetic similarities within and between human populations. Genetics176, 351-359.