Download
1 / 20
200 likes | 438 Views
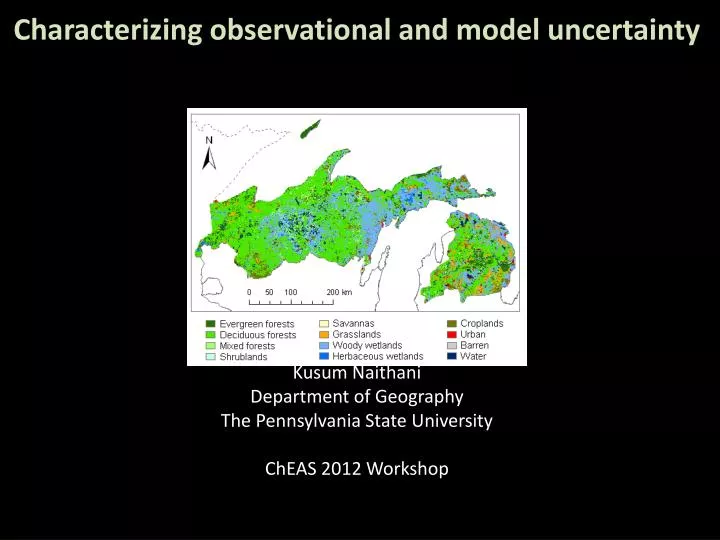
Characterizing observational and model uncertainty Kusum Naithani Department of Geography The Pennsylvania State University ChEAS 2012 Workshop. My Geography and Uncertainty. X. X. My Geography and Uncertainty. X. X. My spatio-temporal pattern and uncertainty. Decade. Year. Month.

E N D
Characterizing observational and model uncertainty Kusum Naithani Department of Geography The Pennsylvania State University ChEAS 2012 Workshop
My spatio-temporal pattern and uncertainty Decade Year Month Day Hour Regional ~100s km2 Leaf ~cm2 Plant 10s cm2 Small Chamber ~m2 Landscape ~ 100s m2 Flux Tower ~1 km2
Goals/Issues • Quantification of regional/global C fluxes and associated uncertainty • -Maps of C fluxes and uncertainty (daily, seasonal, annual, decadal) • -Temporal uncertainty versus spatial uncertainty • Diagnosis of the sources of uncertainty in C fluxes • -Input data (climate, land cover, disturbance, phenology, flux tower) • -Modeling framework (e.g., complex process models vs. statistical models) • -Model structure (5 algorithms at Penn State) • -Spatial representativeness of flux towers • 3. Benchmarking standards for model-intercomparisons focused on uncertainty • 4. Visualization of C fluxes and associated uncertainty -Better ways to visualize mean and uncertainty • -Customize it for the enduser (scientific community, forest service, policy makers, public etc.)
Accuracy and Uncertainty Accuracy: measure of centrality Uncertainty (precision): measure of spread X X X X X High accuracy and Low uncertainty
Accuracy and Uncertainty Accuracy: measure of centrality Uncertainty (precision): measure of spread X X X X X High accuracy and High uncertainty
Accuracy and Uncertainty Accuracy: measure of centrality Uncertainty (precision): measure of spread X X X X X Low accuracy and Low uncertainty
Accuracy and Uncertainty Accuracy: measure of centrality Uncertainty (precision): measure of spread X X X X X Low accuracy and High uncertainty
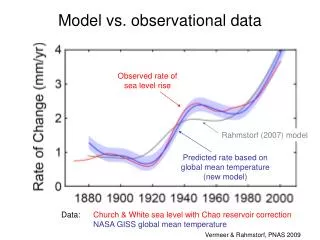
Uncertainty declines with increasing temporal coverage of flux tower data record More data (95% CI / Mean) Less data Naithani et al., in prep.
Uncertainty increases with increasing spatial coverage of flux tower data record Mean One Tower 95 % CI Multiple Towers Naithani et al., in prep.
Influence of spatial and temporal extent of flux tower data on parameter and prediction uncertainty Spatial representativeness Spatial uncertainty Time Temporal uncertainty Space
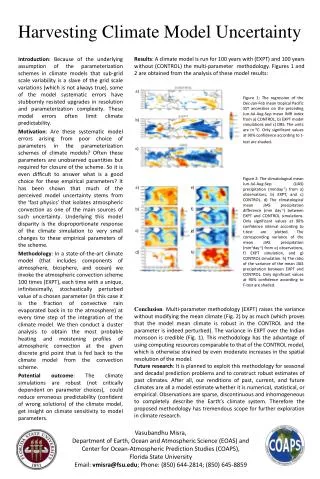
Uncertainty in land cover introduces considerable uncertainty to carbon flux estimates NEE (MODIS) • Wetlands (MODIS) -2.9 Tg C yr-1 0.01% NEE (NLCD) • Wetlands(NLCD) 33 % -9.8 Tg C yr-1 Xiao et al 2012, in review
Choice of modeling approach introduces considerable uncertainty to carbon flux estimates a) Independent a) Common risk c) Hierarchical 16 Eddy Flux Towers e1, e2,….e17 16 Eddy Flux Towers e1….e17 17 Eddy Flux Towers e1, e2, ….e17 q,t q, t q, t q, t q,t q,t q,t Q, t Naithani et al., in prep.
Choice of a particular model introduces considerable uncertainty to carbon flux estimates Representation of different processes Residuals analysis and MIPs
Better communication of modeling outputs in terms of visualization of mean and uncertainty
Thinking about clever ways of communicating science to outside world
In summary there are multiple sources and a great deal of uncertainty waiting to be quantified, analyzed and visualized!
Workshop outcomes • Synthesis paper (s) on assessment and/or visualization of uncertainties in C flux upscaling. • Upscaling methodologies • Comparison of existing products
NACP Thank you! • Mentors • Ken Davis (PI-ChEAS) • Erica Smithwick (PI-ChEASII) • Collaborators/Contributors • Klaus Keller • Robert Kennedy • Jeff Masek • Jingfeng Xio • Nathan Urban • Paul Bolstad • Dong Hua • Data Contributors • Data was contributed by K. Davis, C. Gough, P. Curtis, A. Noormets, J. Chen, A. Desai, B. Cook & K. Cherrey.