Download
1 / 52
520 likes | 521 Views
Learn about null hypothesis, experimental and observational studies, variables of interest, biased questions, sampling methods, and data analysis techniques.

E N D
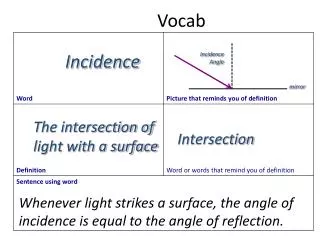
Null Hypothesis • The hypothesis that most people already think is true. Ex. Eating a good breakfast before a test will help you focus • Notation Ho
Alternative Hypothesis • The hypothesis that goes against the current held belief. Ex. Eating a big breakfast does not help you focus before a test. • Notation Ha
Population • The entire group you want information about.
Observational Study • A characteristic is observed and data is collected. No outside factors are placed on the population. (a survey)
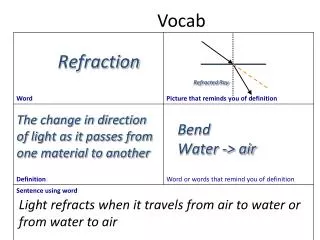
Experimental Study • A treatment is assignment to a group in order to study a specific characteristic. Data is then compared based on the results of the treatment.
Treatment • In an experimental study, the treatment is what is changed or added to the populationor sample.
Variable of Interest • The variable of interest is what characteristic the surveyor wants to know about. NOTE- this is NOT the treatment
Control Group • In an experimental study, this group has no treatment done on them.
Placebo • A treatment that has no effect, however, the subject(s) does not know this. Often times in medical studies, the placebo is a sugar pill.
Placebo Effect • This occurs when subjects on a placebo show change because they think they are on an actual treatment.
Categorical data • Data that cannot be arranged numerically. For example: hair color, gender, ethnicity, religious affiliation, etc.
Quantitative data • Data that can be arranged numerically. For example: height, age, income, number of children, etc.
Closed question • In a survey, this type of question requires the subject to choose an answer based on listed choices. (multiple choice)
Open question • In a survey, this question has no answer choices and leaves the subject to answer freely. “How do you feel about ______”
Biased question • In a survey, a biased question is worded so that the subject would tend to answer in a certain way.
Biased sampling • When some members of a population are more likely to be selected than others.
Non-representative sampling • A sample that does not reflect the makeup of the population (a biased sample). For example population: High School • Sample: Only Freshmen
Response Bias • Responders do not give accurate answers. For example: The subject might be embarrassed or trying to impress.
Non-response bias • Refusal to answer a question.
Observer effect • Similar to response bias. Subjects being observed act differently when they know they are being observed.
Wording of questions • When the wording of questions makes a responder lean to a certain response. This could also occur in a closed question with not enough options.
High Variability • When data is spread over a wide range of values.
Low Variability • When data is not spread out (condensed).
High Statistical bias • When the trial outcome is NOT close to the population mean. • SAMPLE RESULTS • Population mean: 32
Low Statistical bias • When the trial outcome is close to the population mean. • SAMPLE RESULTS • Population mean: 24.5
Undercoverage • Not enough members of the population are being studied. • POPULATION: Sprayberry High School • Sample: 10 students
Census • A study in which the ENTIRE population is sampled.
Sampling Method • How a sample is chosen in a statistical study. If the sample is not picked correctly, all of the data collected could be inaccurate.
Simple random sample • Every subject receives a number, and numbers are randomly selected either through a random drawing or random number generator.
Stratified Random Sample • Population is divided into distinct groups. Then a simple random sample is done for each group. • Ex. Split into boys + girls- then draw numbers out of hat.
Systematic Sample • A rule is used to select members of a population. For example: Every third person who comes through the door will be selected.
Cluster Sample • Clusters are formed which are small scale representations of the population. The entire cluster is studied. • Example: D lunch (has members of all parts of the school)
Convenience Sample • Only members of the population who are easily accessible are sampled. This generally results in poor samples.
Population Mean • The average of EVERY member of the population. This is generally impossible, depending on what your population is. • Notation
Sample Mean • The mean of a sample of the population. • Notation
Univariate Data • When you conduct a study that only looks at one variable, you are working with univariate data.
Bivariate Data • When you conduct a study that looks at the relationship between two variables, you are working with bivariate data.
Histogram • A diagram consisting of rectangles whose height represents the frequency of a variable, and width represents an interval. There is no spacing between the rectangles.
Bar Graph • A diagram in which the numerical values of variables are represented by the height of rectangles with equal width. There is spacing between the rectangles.
Box & Whisker Plot • A graphic way to display the median, quartiles, and extremes of a data set on a number line to show the distribution of the data. Sometimes called a boxplot.
Pie Chart • A type of graph in which a circle is divided into sectors that each represent a proportion of the whole.
Dot Plot • The representation of data by using dots over a number line. The number of dots over each increment on the number lines represents the frequency of the data. (the dots can be Xs as well)
Frequency Table • A table displaying how often each value in a set of data occurs.
Skewed Right • A distribution with most of the observations on the left. (It has a right tail)
Skewed Left • A distribution with most of the observations on the right. (It has a left tail)