Download
1 / 30
310 likes | 985 Views
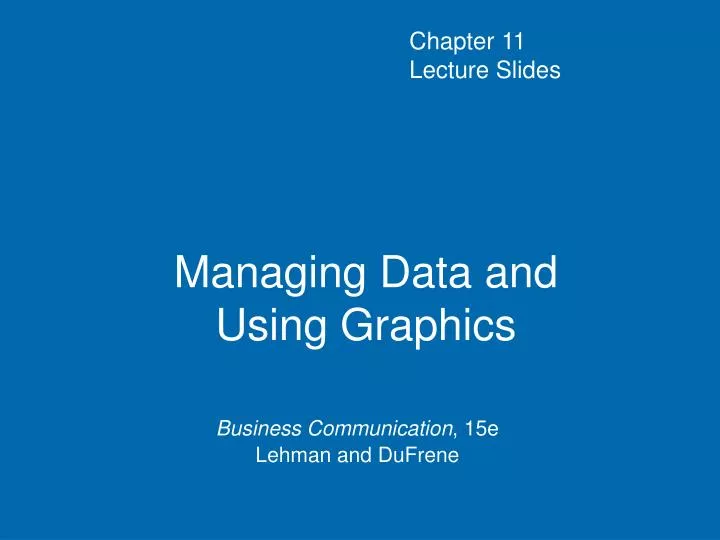
Chapter 11 Lecture Slides. Managing Data and Using Graphics. Business Communication , 15e Lehman and DuFrene. Learning Objective 1. Communicate quantitative information effectively. 1. Communicating Quantitative Information. Classify, summarize, and condense data into manageable size

E N D
Chapter 11Lecture Slides Managing Data and Using Graphics Business Communication, 15e Lehman and DuFrene
Learning Objective 1 Communicate quantitative information effectively. 1
Communicating Quantitative Information • Classify, summarize, and condense data into manageable size • Make information meaningful to audience — why should receiver care • Use common language or common denominators to reduce difficult figures 1
Common Language Common language reduces difficult figures to the “common denominators” of language and ideas. Examples: Fractions, ratios and percentages 1
Communicate Clearly • Convert numbers to percentages • Round off statistics to fractions % 1/4 1
Learning Objective 2 Apply principles of effectiveness and ethical responsibilities in the construction of graphic aids. 2
Using Graphics Effectively and Ethically • Contribute to overall meaning • Reinforce and supplement written or spoken words • Communicate ideas that cannot be conveyed effectively in written form • Have a simple, effective design that is easy to understand • Depict information honestly A graphic should . . . 2
Chartjunk This term, coined by design expert Edward Tufte, describes decorative distractions that bury relevant data. Extreme use of color, complicated symbols and art techniques, and unusual combinations of typefaces reduce the impact of the material presented. 2
Learning Objective 3 Select and design appropriate and meaningful graphics. 3
Bar charts Line charts Tables Pie charts Flow charts Maps Types of Graphic Aids 3
Preparing Effective Tables • Number tables consecutively • Use complete titles to clarify what is included • Label columns clearly • Indent second line of row labels • Place superscript beside entry that needs explanatory note • Document source of data with source note 3
Preparing Effective Line Charts • Use vertical axis for amount and horizontal axis for time • Begin vertical axis at zero • Divide axes into equal increments 3
Preparing Effective Bar Charts • Begin quantitative axis at zero, divide the bars equally, and make them the same width • Position chronologically • Use color variations to distinguish among bars of different data • Avoid 3D formatting • Include complete info for scale and bar labels 3
Ineffective Bar Chart Production for Cutshall Enterprises 3 © 2009 Cengage Learning. All rights reserved.
Types of Bar Charts • Grouped bar chart — used to compare more than one quantity • Segmented bar chart — used to show how components contribute to a total figure • Pictogram — uses images to illustrate numerical relationships 3
Effective Bar Chart 3 © 2009 Cengage Learning. All rights reserved.
Preparing Effective Pie Charts • Position largest or most important slice in 12 o’clock position • Label each slice and include info about quantitative size • Draw attention to one or more slices for desired emphasis • Avoid 3D formatting 3
Ineffective Pie Chart Percentage of City Tax Dollars Spent 3 © 2009 Cengage Learning. All rights reserved.
Effective Pie Chart Profile of Online Customers By Age, 3rd Quarter, 2008 3 © 2009 Cengage Learning. All rights reserved.
Learning Objective 4 Integrate graphics within documents. 4
Using Graphics in Text • Introduce graphic, show it, then interpret and analyze • When possible, position graphic immediately following text introducing it • Avoid only restating what graphic shows; instead, interpret based on audience interest 4
1 2 3 Interpret and Analyze Introduce Show Incorporating text in graphics The Pattern… 4
When Labeling Graphics… • Label each item as a “Figure” followed by a number; then number the items consecutively. • Organizing tables, graphs, maps, and even photographs is easier and writing about the illustrations will be more effective. 4
In Class Assignment • Prepare a table to show the Total Revenue Nashville Sports Connection earned from membership fees for a fiscal period. Fees were collected by type of membership; single, $25; double, $40; family (3+ members), $50; corporate, $22.50; senior, $20. • Nashville Sports Connection has 1,439 single memberships, 642 double, 543 family, 3,465 corporate, and 786 senior memberships.