Download
1 / 30
310 likes | 502 Views
EU eGovernment Benchmark Or … Can eGovernment help deliver services “twice as good, in half the time, for half as much?”. Dinand Tinholt Capgemini. Agenda. Why improvement is so needed? Why benchmark? What is measured? How is the EU doing? Some Insights and examples .

E N D
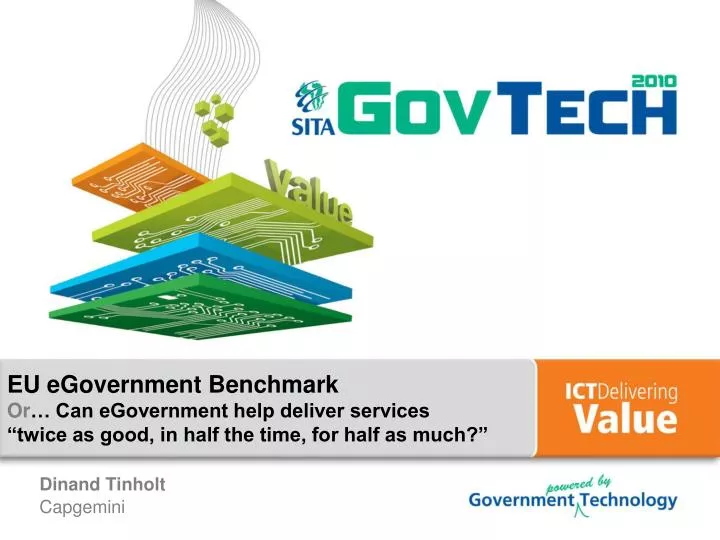
EU eGovernment Benchmark Or… Can eGovernment help deliver services “twice as good, in half the time, for half as much?” Dinand Tinholt Capgemini
Agenda • Why improvement is so needed? • Why benchmark? • What is measured? • How is the EU doing? • Some Insights and examples
Most Countries face a long-term budget crisis Projected debt and balances compared Larger total debt Bad balance and high debt Moderate balance and high debt Moderate balance and low debt Oil rich Larger deficit
Level 1 Level 2 Dept Dept Dept Level 3 Dept Dept Dept Data Can we fundamentally change the model? Administration-Centric Model of “YOU” Customer-Centric Model of “ME” …and what role would eGovernment play if we did?
Agenda • Why improvement is so needed? • Why benchmark? • What is measured? • How is the EU doing? • Some Insights and examples
Benchmarking ensures governments keep up with the times • The twin challenges of the next decade are major ones • Slowdown of economic growth • Global population tripling in one lifetime • Leading to: Squalid urban conditions, rising public health costs, environmental and security challenges… • People get lost in the information overload and • Are increasingly disengaging from democratic processes • Benchmarking informs and steers public sector performance and is hence an essential part of the response • Can make public services ‘twice as good, in half the time, for half the cost’ • Governments respond faster and smarter • Customers are taking charge • Benchmarking is the first step of a continuous benchlearning and improvement cycle
And benchmarking makes policy ‘real’ • Countries move from high level Ministerial Declarations… • To policy objectives, programmes, and actions • To insight as to how countries are progressing • To learnings about areas of improvement • Countries rally behind strategic and high-level ‘sweeping’ declarations: “..to become the most dynamic knowledge-based economy in the world” • But how will we know if we are there? We benchmark to address these two aspects Benchmarking can assess the status of policy implementations in countries (e.g. measure compliance) ... AND let countries learn about how policies are implemented (action learning) ... AS WELL AS what countries are doing to address other elements through extra services / process streamlining
Benchmarking has three key phases: Scan- Focus- and most importantly Act What Why SCAN Policy and strategy High-level goals Determine the choice of the benchmark framework Benchmarking FOCUS Naming and faming … are translated into metrics Measures bring focus ACT And streamline action Benchlearning … and translated into implementation action
Benchmarking is used to inform and improve, by continuous comparison: to benchlearn 1 Benchmark short-term project impact Impact 2 Long-term performance improvements With Benchmarking • FOCUS • Step 4: Diagnostic benchmarking specifies where key performance shortcomings lie • ACT • Step 5: Benchlearning makes results actionable and turns organisations into learning entities, supporting strategy formulation and progress monitoring Self-sustainability of improvement cycle: ‘Bench-learning organisation’ 2 • SCAN • Step 1: Framework development i.e. assessing the current situation and designing the future state • Step 2: Data gathering • Step 3: Segmentation to ensure comparison with the right peers 1 Without Benchmarking t7 0 t1 t2 t3 t4 t5 t6 Time
Agenda • Why improvement is so needed? • Why benchmark? • What is measured? • How is the EU doing? • Some Insights and examples
The EU eGovernment Benchmark • European Commission sponsored • Collaborative process with countries • Since 2001 – so years of comparable data • 14,000 websites • 20 ‘basic services’ • eProcurement (2009) on 754 Procurement Portals • User-Experience Indicators
The basic framework for maturity The Benchmark’s five-stage maturity model 100% Full online availability Targetisation (Pro-active, automated) Transaction (Full electronic case handling) 60% Two way interaction (Electronic forms) 80% Maturity 40% One way interaction (Downloadable forms) Information 20% 0% Sophistication stages
The 20 “Basic Services”: 12 Citizen & 8 Business Citizen Business • Income taxes • Job search services • Social security benefits • Unemployment benefits • Child allowances • Medical costs • Student grants • Personal documents • Passports • Driver’s licence • Car registration • Application for a building permission • Declaration to the police • Public libraries (catalogues, search tools) • (Birth and marriage) certificates • Enrolment in higher education • Announcement of moving • Health-related services • Social contribution for employees • Corporate tax • VAT • Registration of a new company • Submission of data to statistical offices • Customs declaration • Environment-related permits • Public procurement
Overview of the Benchmarking Report 20 Basis Services + eProcurement Full On-Line Availability A Sophistication (quality) eP: Availability & fulfilment process User-Experience (pilot) 5 Indicators B Nationale portals Agenda 2015 Emerging Insights Development of the measurement C Insights from Country Reports Improvements for C / B / G Good practices Country Reports Summary of results & key data for each (of 31) country D
Agenda • Why improvement is so needed? • Why benchmark? • What is measured? • How is the EU doing? • Some Insights and examples
EU Benchmark: Key Points • EU27+ advancement: Full Online Availability 71% (59%: ‘07); Sophistication 83% (76%: ’07) • eProcurement Availability (new): 56% EU27+ ave.; well behind 2010 target of 100%. Key for single open market. Several good practice examples of nationally controlled public expenditure • Some countries show leapfrog results; some continued high performance. Five characteristics for success offered • Increased focus on ICT as a means to address fiscal and budget constraints • User Experience (pilot) measures show EU27+ averages from 34% to 81% for the five measures, with some notable examples of leading practices • Personalised services gaining ground and becoming more commonplace across Europe • User empowering technologies push Governments to redesign their eGovernment services • Upgrade of measurement system is needed and planned – in collaboration with countries
Results @ a glance: 20 Services Full On-Line Availability Trend from 2001 to 2009 – EU15, New Member states and EU27+ • Austria • Malta • Portugal • UK • Sweden • Slovenia • Estonia Full On-Line Availability Sophistication by User • Malta • Portugal • Sweden • Austria • Slovenia • Estonia Overall Business Citizen
Priorities differ with maturity of eGovernment development • ‘OLD’ Member States • About Customer: • Portal; Citizen; Business; User; customer; Personalised; Comprehensive; single; burden (reduction); Democracy • About Technology: • Digital; Open • About Governance: • Delivery; Cooperation; Productivity; Shared; Programme; Projects; Comprehensive; governance • Focus of NEW Member States • Technical Infrastructure • Regulatory Environment • Less on Customer • Strategy
The EU has dispersed results on (most) User-Experience pilot indicators
The 2010 indicators have been set with the EC and 32 countries as follows Core indicators are based on sound measurement experience. They imply that each government will be ranked. Proof-of-concept indicators are based on some experience and rolled out throughout all countries for the first time. Results are mainly visualised qualitatively with some scoring elements.
The transformation journey of the benchmark eGOV measurement ambition 2010 2011 2012 2013 Customer satisfaction monitoring Channel independent eGov infrastructure 20 basic services User needs / insights User experience eDemocracy eInclusion User experience Multi-channel approach, User centricity eProc pre-award Cross-borderservices Front office eProc enhancement Cross-borderservices 20 basic services Life events Take-up process eProc take-up Open government Horizontal enablers Mid office eProc pre-award Action learning groups Country insights Transparency International competition Back office Measurement process Reporting
So how is South Africa doing?And who can you compare yourself to?
Agenda • Why improvement is so needed? • Why benchmark? • What is measured? • How is the EU doing? • Some Insights and examples
From ‘YOU’ to ‘ME’Can we fundamentally change the model? Level 1 Level 2 Dept Dept Dept Level 3 Dept Dept Dept Data The “YOU-centric” model The “ME-Centric” Model Can we make government services… “Twice as good, for half as much, in half the time?”
Mrs Ali’s Story… The economics of NOT acting becomes frightening
And Beyond the ‘Tipping Point’ Gov-drivenCustomer Centricity Customer-drivenCustomer Centricity Cost to Serve EU 27+ Tipping Point Customer Engaged Customers are actively engaged in service design, and help reduce consumption through agreeing their responsibilities with Government delivering a more sustainable solution Government takes positive steps to engage its customers and design its services to be customer oriented and efficient Customer Aware Government focus on efficient service delivery, setting customer service levels, and basic customer segmentation Administration Centric Nascent Emerging Developing Maturing Innovative Maturity Stage / Time
“Faster, Smarter, Better eGovernment” Capgemini’s 8th EU eGov benchmark survey: http://ec.europa.eu/information_society/eeurope/i2010/benchmarking/index_en.htm http://www.egov2009.se/about-the-conference/links http://www.capgemini.com/insights-and-resources/by-publication/2009-egovernment-benchmark/ Thank You! Contact: dinand.tinholt@capgemini.com +31 6 27159 294