Download
1 / 8
80 likes | 188 Views
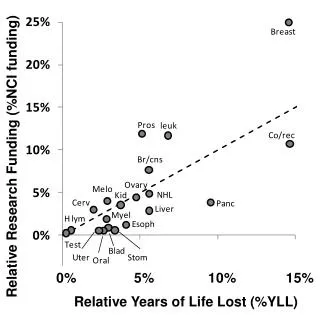
Correlation Between Health Risk Factors and Potential Years of Life Lost. Jacob C Heinrichs Apr 25 2013. Hypothesis. 1. Started out as a theory that West Coast Prevailing on shore winds decreases effects of PM2.5, PM10, CO, OZONE, and Sox

E N D
Correlation Between Health Risk Factors and Potential Years of Life Lost Jacob C Heinrichs Apr 25 2013
Hypothesis • 1. Started out as a theory that West Coast Prevailing on shore winds decreases effects of PM2.5, PM10, CO, OZONE, and Sox • 2. Finalized as a theory that all categories of health risk factors collected from the Census should show a correlation with Potential Years of Life Lost per 100,000 people. • Poor or Fair Health • Low Birth Weight • Smoking • Obesity • Physical Inactivity • Unemployment • Fine Particle Concentrations • Drinking Water Quality
Objective • Show Correlation between Risk Factors and YPLL • Least Squares Regression • Correlation Coefficient • Bootstrap Samples and Corr. Coef
Data • Data Collected from County Health Rankings & Roadmaps program is a collaboration between the Robert Wood Johnson Foundation and the University of Wisconsin Population Health Institute • 2013
Bootstrap Histogram Correlation Coefficient: 0.742 Ideal chi2 = 11.0705 Calculated chi2 = 8.5069
Conclusions • As expected the combined environmental and socio-economic risk factors showed a strong correlation to the Potential Years of Life Lost per 100,000 people.