Download
1 / 14
140 likes | 152 Views
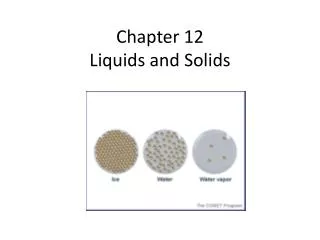
Chapter 10 – Liquids and Solids 10.8 – 10.9 Notes. AP Chemistry. Changes in State. The state of matter a substance exists in depends on its environment. Three states of matter: Solid Liquid Gas. Vapor.

E N D
Chapter 10 – Liquids and Solids10.8 – 10.9 Notes AP Chemistry
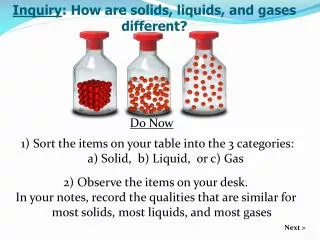
Changes in State • The state of matter a substance exists in depends on its environment. • Three states of matter: • Solid • Liquid • Gas
Vapor • Vaporization (evaporation) is the endothermic process in which a liquid becomes a gas. • Heat of Vaporization: • Energy needed to vaporize 1 mole of liquid • Water has a high ΔHvap = 40.7 kJ/mol, meaning it can absorb a lot of heat
Vapor Pressure • Vapor – gas phase of a substance that exists as a liquid at 25oC and 1 atm. • There is a dynamic equilibrium between a liquid and its vapor. • A liquid/vapor system has reached equilibrium when the rate at which liquid molecules become vapor and vapor molecules become liquid is the same. • Vapor pressure – pressure exerted by vapor at equilibrium
Measuring Vapor Pressure • Vapor pressure can be measured using a simple barometer. • Patmosphere = Pvapor+ P Hg column • Pvapor = Patmosphere - P Hg column • Vapor pressure of a substance increases with temperature.
Graphical Analysis of Vapor Pressure vs. Temperature • A plot of vapor pressure vs. temperature is nonlinear. • ln(Pvap) vs. 1/T(K) is linear and follows y = m x + b • y = lnPvap, x = 1/T, m = -ΔHvap/R, C = a constant characteristic of the liquid R = 8.31 J/(Kmol) • Clausius-Clapeyron Equation: lnPvap = -(ΔHvap/R)(1/T) + C Or ln(Pvap,T1/Pvap,T2) = (ΔHvap (1/T2-1/T1))/R • This relationship is useful for determining either enthalpies of vaporization from vapor pressure measurements or vapor pressures at different temperatures.
Example • The boiling point of acetone at 760. torr is 56.5oC. At an elevation of 5,300 ft the atmospheric pressure is 630. torr. What would be the boiling point of acetone (ΔH = 30.2 kJ/mol) at this elevation? What would be the vapor pressure of acetone at 25oC at this elevation?
Sublimation • A solid to gas phase change is called sublimation. • This occurs because solids have vapor pressures.
Changes of State • Changes in state can be represented using a heating curve (a plot of temperature vs. time). • Solid↔Liquid = Heat of Fusion (ΔHfus) Point at which solid and liquid have identical vapor pressures • Liquid↔Gas = Heat of Vaporization (ΔHvap) Point at which liquid and vapor have the same vapor pressure under conditions in which the system is under a constant pressure of 1 atm. • ΔHvap> ΔHfus
Normal Melting and Boiling Points • Normal Melting Point – temperature at which the solid and liquid states have the same vapor pressure under conditions where the total pressure is 1 atmosphere • Normal Boiling Point – temperature at which the vapor pressure of a liquid is exactly one atmosphere
Heating Curves • When heating or cooling a substance at a constant rate q = mcΔT. • At phase boundaries, the temperature remains constant until the entire substance has changed state. Only then can the substance be heated or cooled. • Superheating and cooling can occur when a liquid is heated or cooled rapidly.
Example • A 0.250 g chunk of sodium metal is dropped into a mixture of of 50.0 g of water and 50.0 g of ice, both at 0oC. The reaction is 2Na(s) + H2O(l) 2NaOH(aq) + H2(g) ΔH = -368 kJ/mol • Will the ice melt? Assuming the final mixture has a specific heat capacity of 4.18J/goC, calculate the final temperature. The enthalpy of fusion for ice is 6.02 kJ/mol.
Phase Diagrams • Phase diagrams represent the phases of a substance as a function of temperature and pressure. • Phase diagrams represent a substance in a closed system.
Phase Diagrams Continued • Critical Temperature – temperature above which no applied pressure can liquefy a vapor • Critical Pressure – pressure required to produce liquefaction at the critical temperature • Critical Point – point at which the critical temperature and pressure are achieved • Triple Point – point at which the vapor pressure of the solid, liquid, and gaseous phases are in equal