Download
1 / 34
340 likes | 486 Views
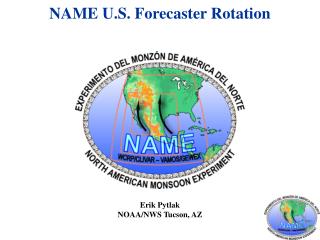
WindSat Vector Maps as Forecaster Products. Thomas F. Lee, Jeffrey D. Hawkins, Mike H. Bettenhausen. Naval Research Laboratory Monterey and Washington DC California. OCONUS GOES-R Proving Ground Conference Juneau, AK July 26 – 28 2011. WindSat Background. Launched in 2003

E N D
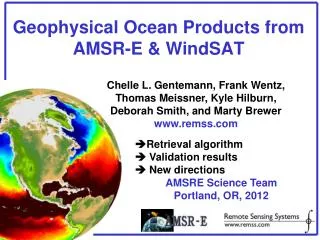
WindSat Vector Maps as Forecaster Products Thomas F. Lee, Jeffrey D. Hawkins, Mike H. Bettenhausen Naval Research Laboratory Monterey and Washington DC California OCONUS GOES-R Proving Ground Conference Juneau, AK July 26 – 28 2011
WindSat Background • Launched in 2003 • On Coriolis Satellite, 830 Km, 1025 Km Swath Width, Conical • Scanner • First space-borne polarimetric microwave radiometer • Primary purpose is to measure ocean surface wind vector • Also retrieves rain rate, cloud liquid water, total precipitable water
Early Concerns • What’s WindSat? • Is that a Scatterometer? • WindSat is too affected by cloud water • Concerns about vector quality • Doubts about ability to retrieve high winds • Doubts about ability to retrieve low winds • Doubts about use to monitor tropical/extratropical cyclones • R&D, not operational
Eight Years after Launch • Routine assimilation of vectors into NWP • Realtime use of vectors and imagery to monitor TC’s • Wind retrievals getting better all the time • More “all weather” retrievals & high winds • Very successful demonstration!
Stokes Vector As a polarimetric radiometer, WindSat measures not only the principal polarizations (vertical and horizontal), but also the cross-correlation of the vertical and horizontal polarizations. The cross-correlation terms represent the third and fourth parameters of the modified Stokes vector, defined as In this definition, Tv, Th, T45, T-45, Tlc and Trc represent brightness temperatures (radiances) at vertical, horizontal, plus 45°, minus 45°, left-hand circular, and right-hand circular polarizations, respectively. The Stokes vector provides a full characterization of the electromagnetic signature of the ocean surface and the independent information needed to uniquely determine the wind direction. -- Peter Gaiser
Sensing Mechanism Wind Speed Effect Wind Direction Effect It has long been known that the microwave emission from the ocean surface depends on the wind speed at the surface. As the winds increase, the seas become rougher and the microwave emission increases. However, the wind-driven waves on the ocean surface are not isotropic; their distribution varies with wind direction. Therefore, the intensity of the emission depends not only on the wave structure, but also on the orientation of the wind-driven waves. – Peter Gaiser
Products Used in this Talk 1. Naval Research Laboratory http://www.nrl.navy.mil/WindSat/ 2. Remote Sensing Systems http://www.ssmi.com/windsat/windsat_browse.html 3. AWIPS
Validation NRL Version 2 Wind Speed Bias Wind Direction RMS Selected Ambiguity
Data Assimilationand Utilization • Near real-time processing of imagery and ocean EDRs at US Navy Fleet Numerical Meteorological and Oceanographic Center (FNMOC) • Tropical cyclone monitoring NRL-Monterey, FNMOC, Joint Typhoon Warning Center, National Hurricane Center, all WMO Tropical Cyclone Centers (http://www.nrlmry.navy.mil/TC.html) • Data assimilation into numerical weather prediction models: NRL/FNMOC, AFWA, NCAR, ECMWF, NCEP, Met Office, AES, MeteoFrance, JMA, NASA/GMAO
Rain Flagging • For data assimilation: > 0.2 mm Cloud Liquid Water (CLW) • For forecaster products: Plotted on top of CLW (0.0 – 0.5 mm) Hurricane Earl 3 September 2010 1118 UTC Products: http://www.nrl.navy.mil/WindSat/
Hurricane Earl Zoomed 3 September 2010 80 knots max wind
Extratropical CycloneNortheast Pacific Good Agreement over 10-15 Knots Good Agreement near 50 Knots winds
Tehuantepec Gap Wind2007-03-07 Mexico Mexico WindSat High Resolution QuikSCAT 25-km
Southern Californian Offshore Winds & Fires WindSat QuikScat Southern California MODIS (Steve Miller) F13 Winds Remote Sensing Systems
Eastern Pacific Cold Front -- Winds 29 Dec 2003
Eastern Pacific Cold Front -- PWV 29 Dec 2003
Arctic Winds during 2007 2007/08/14 2007/09/13 2007/10/15 2007/11/15 August September October November From: Remote Sensing Systems
Continental Cold Air Outbreak 30 November 2010
Canada & Alaska Gap Winds 17 November 2010
Taiwan Straits December 27 2007
Conclusions • WindSat capable of retrieving winds of 0 to 30 m/s (about 0 to 60 kt) • Retrieval of near-hurricane force winds possible in tropical cyclones • Cloud Water contaminates more than for Scatterometry • Display of vectors on cloud liquid water plots increases forecaster acceptance and assessment • Possible to view many wind systems (e.g., gap winds) with detail comparable to QuikScat • AWIPS implementation fine for now
Next Generation Dual Freq Scatterometer • DFS is proposed to fly onboard the Global Change Observation Mission-Water Cycle (GCOM-W) • Satellite series planned by the Japanese Aerospace Exploration Agency’s (JAXA) • Developed by NASA Jet Propulsion Laboratory (JPL) • DFS design uses synergy between C-and Ku-band scatterometry and AMSR radiometry to provide improved OVW measurements capability • High wind speed retrieval capability • Near-all-weather conditions • Higher spatial resolution
WindSat compared to Speed Only Sensors RSS SSM/I RSS “ALL Weather” WindSat RSS AMSRE
NRL Version 2 • Three resolutions: • Low: 50 km x 71 km • Medium: 35 km x 53 km • High: 25 km x 35 km
Typhoon Songda (37 GHz) SSM/I WindSat Products: http://www.nrlmry.navy.mil/tc_pages/tc_home.html
Tropical Cyclone FixingTropical Storm Marty, Eastern Pacific GOES Infrared WindSat 37 GHz Color Composite SSMI 85 GHz
Open Water in the Arctic October 10 2007
Hurricane Earl Zoomed : NOAA/AOML/Hurricane Research Division.
Pacific Northwest Front March 3 2009
Central Pacific December 01 2004
Outline • Introduction • Background • Retrievals • Utilization and Assimilation • Rain Flagging • Examples • Conclusions