Download
1 / 23
230 likes | 234 Views
HBD Performance Estimates. Zvi Citron 3 April 2008 HL Meeting. A quick HBD refresher: Run 4 Status. Currently the di-electron continuum measurement is afflicted with a poor signal to background ratio in the region of interest. The Combinatorial Background.

E N D
HBD Performance Estimates Zvi Citron 3 April 2008 HL Meeting
A quick HBD refresher: Run 4 Status Currently the di-electron continuum measurement is afflicted with a poor signal to background ratio in the region of interest.
The Combinatorial Background • The combinatorial background is dominated by low mass sources, i.e. Dalitz and conversions. • If we could reconstruct all masses of these low mass sources then we could pair them only with each other based on mass and we’d be fine. • But we can’t (incomplete acceptance and the B field cutoff get us here). • So instead we could use the HBD.
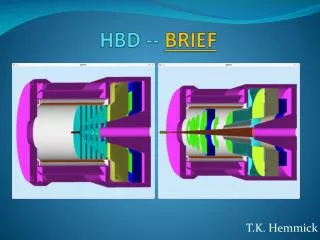
The principles of the HBD • The HBD is close to the beam pipe in a field free region. • It uses opening angles as a proxy for mass measurements. • Electrons produce Cherenkov light in the HBD which are detected as blobs on the detection plane (photo-sensitive GEMs). • The amount of light in the blob and its shape tells us whether the electron was “solo” or “double”. • A double implies a small opening angle, i.e. two electrons traveling very close to each other, and is therefore identified as Dalitz or conversion. • So effective use of the HBD depends on differentiating between “solo” and “double” electrons.
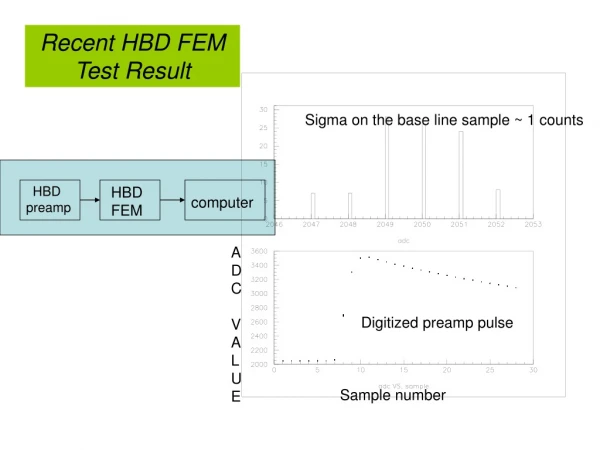
Lucite with Al/MgF2 coating Investigation of the detector’s response to light. • To measure the detector’s response to light we used a a cube containing an 241Am source and a silicon surface barrier detector. (It also contains an 55Fe source for gain calibration.) • This is a triggerable calibrated light source from which we could measure a clear light signal.
Results of Light Cube Tests • The number of photoelectrons in the light signal was calculated in two ways. • Using the 55Fe signal, whose electron output is well known, to calibrate the light signal in electrons. • Using the shape of the light signal and what we know about statistics to determine its mean number of electrons. There is good agreement between the two methods and our expectation. 55Fe method gives 5.1 ± 0.2 Shape gives ~6.1 (Systematic errors are not yet taken into account)
Shape Fitting Method • A little more detail on this method is relevant for the next topic so bear with me… • The light signal is compared with a Monte Carlo simulation which uses a Poisson distribution around a <photoelectrons> convulted with an exponential to simulate gain. (More details on the MC in a little bit). • The MC is run for multiple values of <pe>. • The ratio of the MC and data is fit to a flat line of 1 and the chi2 of this fit is minimized to find the <pe> of the light signal. • The good agreement imply that the MC is a robust description of the data!
What will the HBD do for errors in the dielectron continuum? How does the <photo_electrons> affect the ability to distinguish single electron signals from double electron signals (the ones we want to reject)? How does the above double electron tagging capability affect the background reduction? How does the background reduction affect the significance of di-electron measurements?
To answer these questions… • Using a Monte Carlo simulate the HBD’s response to solo and double electrons, for different <photo_electrons>. • For a given solo efficiency, E, what is the double tagging efficiency, . • For a given , find the reduction of the combinatorial background, R, using the cocktail to calculate the combinatorial background. Of course R will also depend on E and this should be corrected for, but I’ll hold off on that until the next step. • Given E we can define the pair efficiency = E2. For a given R and what is the improvement of the equivalent statistical significance (i.e. combined systematic and statistical significance) with a working HBD.
Singles vs Doubles in MC • To estimate the single and double response I used a simple MC which for an inputted <pe>: • Calculates an actual number of pe via a random number from a Poisson distribution with a mean = <pe> • For each pe calculates an avalanched signal size via a random number from an exponential distribution (centered around 1 to stay in units of pe) • This values are summed to form the single signal and the same thing is done using a Poission with mean = 2<pe> for the doubles.
E E <pe>=15 <pe>=25 pe pe Cut is made on the total spectrum at 5 pe on the left, and at a fixed percentage of the singles on the right. E is the fraction of the solo spectrum accepted, is the fraction of the double spectrum rejected.
Cut on Solo Spectrum Jitter due to finite binning CDR Run 7 Scale the fraction of tagged doubles,, by 90% and plot against <pe> (the input for each MC) on the x axis. Remember that is not the quantity to be optimized because, our signal drops like the efficiency =E2.
Background Estimation • Estimate the combinatorial background using the cocktail. • Usually the cocktail is used to simulated physics, i.e. particles that come from the same vertex are paired. • Here I make random pairs to simulate combinatorial background (following Axel’s method from a few years ago). • EXODUS generates electrons with kinematics, parent id, etc weighted appropriately. • If the parent is a pion or an eta apply a rejection of 1- • Add in hadrons, charm, and then make pairs for the background. • The ratio of the background without the HBD (=0) to with it operating (>0) is R.
A Slight Digression • The combinatorial background from the cocktail is too low compared to Run 4 data. • Some calculations for the Run 7 BUP attributed this difference to hadron contamination in the data. • In the best case the difference is indeed do to hadron contamination, and (almost) all of this contamination would be rejected by improved e-id using the HBD. This would improve the background reduction (R) by a factor of 2.29 • In the worst case there would be no background reduction due to improved e-id.
Background reduction But R(<pe>) is not the quantity of merit because of course it will improve as E decreases but our signal degrades. In the best case of improvement due to eid R->R * 2.29
Define the Effective Signal with .12% .2% Equivalent sample size if there were no background This is the quantity of merit for us.
HBD Effect HBD will introduce: With f the increase in stats, the electron pair efficiency, and R the reduction of the background.
Measure of Improvement The measure of improvement In Run 4, in the bin between 430 and 550 MeV there were 311 signal counts with a signal to background ratio of 1:175.
Improvement of Significance CDR Run 7 With a Run 4 sized data set (f=1)
Best Case Scenario CDR Run 7 Best case: there was hadron contamination in Run 4 and the HBD gets rid of almost all of it. (Run 4 sized data set f=1)
Improvement with a larger data set f is the increase in statistics compared to Run 4
Conclusions • On the bench testing allows us to examine a GEM stack’s response to light in a controlled environment. • The thus observed light is well understood. • A MC simulation demonstrates that the HBD can be effective even with lower than ideal light yield. • We can further improve the light yield by: • Increasing gas flow thereby reducing the number of photons lost in the gas due to impurities. • Studies with the light cube have shown that we can recover photons by improving some HV operating conditions. • We expect improved stability (a topic for another time).