Download
1 / 66
670 likes | 918 Views
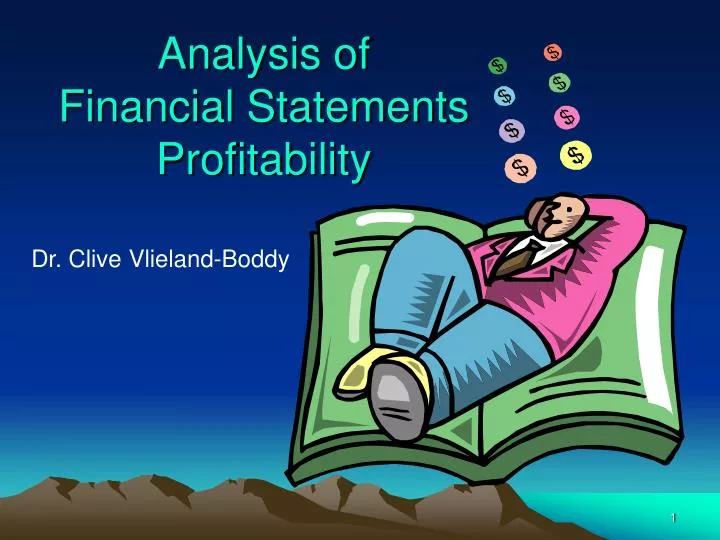
Analysis of Financial Statements Profitability. Dr. Clive Vlieland-Boddy. What is Profitability?. Is it always all about “success?” Or about achieving what is expected or perhaps better than expected!. Is it about goals being achieved! Or about managing risk and minimising these?

E N D
Analysis of Financial StatementsProfitability Dr. Clive Vlieland-Boddy
What is Profitability? • Is it always all about “success?” • Or about achieving what is expected or perhaps better than expected!. • Is it about goals being achieved! • Or about managing risk and minimising these? • Profit means that revenues are higher than costs. But by how much…. • Is it always just about $$$$$$$$$....
Profit Mastery Content Steps to Building Value • Effective Strategy • Effective Planning. • Managing Cash Flow • Managing Growth • Ensuring Sustainability
Improving Profitability can be achieved by: • Selling More • Selling at a better margin • Better use of Capital Structures • More efficient use of assets (Ryanair Vs BA) • Maintaining a competitive advantage. • Developing core competitances.
But what is Profitability? How do we measure it? • It is how successful the business is. • But how do we assess that? • Yes… we can evaluation of the Income Statement. • We can make a comparison of results • But we need to know what we are going to measure.
Profitability • Profit is the number one objective of all firms • Profitability measures look at how much profit the firm generates • Although we talk about CSR and the environment, until a business is profitable how can it afford to be environmentally friendly? • However, we must accept that sustainability is vital and “PROFITS” must be linked to that goal.
Profitability Ratios • Profitability measures look at how much profit the firm generates from sales or from its capital assets • Different measures of profit – gross and net • Gross profit – effectively total revenue (turnover) – variable costs (cost of sales) • Net Profit – effectively total revenue (turnover) – variable costs and fixed costs (overheads)
Profitability Ratios • Gross Profit Margin • Net Profit Margin • Return on Assets • Return on Equity • Return on Capital Employed
Gross Profit Margin • The percentage that a company makes on selling products after taking into account the direct costs of that sale. • This is the Gross Profit as a percentage of Sales. • This Is by far the most important profitability ratio.
Gross Profit Margin Gross Profit Net Sales Indicates the efficiency of operations and firm pricing policies. Profitability Ratios Income Statement / Balance Sheet Ratios Profitability Ratios
Gross Profitability • The higher the better • Enables the firm to assess the impact of its sales and how much it cost to generate (produce) those sales • A gross profit margin of 45% means that for every £1 of sales, the firm makes 45p in gross profit
Gross Profit % Gross Profit Revenues = 12,400 = 13% 97,500
Gross Profit Margin Total Gross Margin Dollar Amount Percentage Net Sales $100 100% - 40 Cost of Goods Sold - 40 Gross Profit Margin $ 60 60% Unit Gross Margin Unit Sales Price $1.00 100% - 0.40 Unit Cost of Goods Sold - 40 Unit Gross Profit Margin $0.60 60%
Comparing Business Models Let’s compare Maxi with Mini Maxi Mini Net Sales $321,062 $205,853 Cost of Sales $130,455$ 67,947 Gross Profit $190,607 $137,906 Gross Margin 59% 67% Which one has a more profitable business model?
Gross Profit or Margin % • Definitely the most important ratio. • Tells us how management are controlling the business. • However there may be external influences.
Example 1 • Company has Sales of $12,500,000 and Cost of Goods Sold (COGS) of $7,500,000. This means that the Gross Profit is $5,000,000 ($12.5m-7.5m) Its Gross Margin or Profit Ratio is 5,000,000 = 40% 12,500,000 If 2009 was 39.7% and 2008 was 39.3%
CompanyIndustry 40.0% 40.1% 39.7 40.8 39.3 40.6 Year 2010 2009 2008 Profitability Ratio Comparisons Gross Profit Margin The Company has a good and improving Gross Profit Margin inline with the industry
Key Factors Affecting the Gross Profit Margin • Price per unit sold • Cost of Goods Sold per unit • Mix of the goods and services sold (i.e. the “product mix”)
Other ratios of Income/ Expenditures • It is also useful to compare items of expenditure as a percentage of Income. • E.g. say advertising or Research & Development. • How does this compare to previous years and does an increase affect revenues. • How does it compare to what competitors spend as a percentage of revenues.
Net Profit Margin • The profit margin tells you how much profit a company makes for every $1 it generates in revenue or sales. • Profit margins vary by industry, but all else being equal, the higher a company's profit margin compared to its competitors, the better.
Net Profit Margin Net Profit after Taxes Net Sales Indicates the firm’s profitability after taking account of all expenses and income taxes. Profitability Ratios Income Statement / Balance Sheet Ratios Profitability Ratios
The Calculation of Net Profit Margin • Net Income After Taxes ÷ Total Revenue • = Net Profit Margin
Example 2 • Company has Net Profits after taxes of $512,500 with sales of $12,500,000. Its Net Margin Ratio is 512,500 = .041% 12,500,000 If 2009 was 4.9% and 2008 was 9%
CompanyIndustry 4.1% 8.2% 4.9 8.1 9.0 7.6 Year 2010 2009 2008 Profitability Ratio Comparisons Net Profit Margin The Company has a poor and Declining Net Profit Margin.
Example 3 • Better Buys sells 100,000 widgets at $5 each. • It generates a total of $500,000 in revenues. • The company's cost of goods sold is $2 per widget. • Therefore 100,000 widgets at $2 each is equal to $200,000 in costs. • This results in a gross profit of $300,000 ($500k revenue - $200k cost of goods sold). • The Gross Profit Margin of 60%. (300,000 divided by 500,000…………..
Example 3 • If its operating expenses were $180,000, this would leave a Pre Tax Profit of $120,000. Subtracting the tax bill of $50,000, we are left with a net profit of $70,000. • Net Profit Margin would be 14% (70,000 divided by 500,000)
Caution • This is the standard version of Net Profit Margin. • Many will adapt this. • Must ensure that you are consistent
Investors Provide the capital
What do Investors want in Return • Expect a minimum %. • Expect a sustainable business with growth potential • Expect good CSR.
SO….. • Management must ensure that they meet shareholder expectations. • That they invest the funds to generate in excess of the expected returns that the shareholders want. • Therefore the cost of capital being what the shareholders demand must be used as the minimum return that management must achieve from its investments.
Return On Investment • This is the relationship of investment to the return that it makes. • This can be evaluated either before of after tax. • Before tax taxes account of the fact that tax is normally outside the control of management. • It also takes account of the earning power not how financed.
The 3 Key Ratios for ROI • ROE (Return on Equity) • ROA (Return on Assets) • ROCE (Return on Capital Employed)
Return on Equity • Reports the percentage of income earned for each dollar invested by the owners of an entity. • Computed as Net Income divided by Average Total Shareholders Funds. • This tells us how efficiently we use our invested capital. • As most of Equity is Retained Earnings, ROE measures how efficiently management uses that accumulated profit to make more money
Example • Company has profits after tax of $512,500 with assets of $12,200,000 512,500 = .042% 12,200,000 If 2009 was 6% and 8.1% in 2008
Example • Company has profits after tax of $512,500 with total Equity (Shareholders funds) of $6,400,000 512,500 = .08% 6,400,000 If 2009 was 6% and 8.1% in 2008
Return on Equity Net Profit after Taxes Shareholders’ Equity Indicates the profitability to the shareholders of the firm (after all expenses and taxes). Profitability Ratios Income Statement / Balance Sheet Ratios Profitability Ratios $512k $6,400k = .08
CompanyIndustry 8.0% 17.9% 9.4 17.2 16.6 20.4 Year 2010 2009 2008 Profitability Ratio Comparisons Return on Equity The Company has a poor and declining Return on Equity.
Return on Assets • Reports the percentage of income earned for each dollar invested in an entity’s resources • Computed as: Net Income divided by Average Total Assets • It is a measure of the productivity of an enterprise’s total resources. • ROA expresses how well a company uses it's assets to make money • This tells us how efficient we are at earning returns based on the dollars invested into assets. • Some Analysts add the interest expenses back into the equation to better gauge the results of company activities without the cost of financing.
Return on Assets Net Profit after Taxes Total Assets Indicates the profitability on the assets of the firm (after all expenses and taxes). Profitability Ratios Income Statement / Balance Sheet Ratios Profitability Ratios $512k $12,200k = .042
CompanyIndustry 4.2% 9.8% 6.0 9.1 8.1 10.8 Year 2010 2009 2008 Profitability Ratio Comparisons Return on Assets The Company has a poor Return on Assets which is sharply declining.
ROE Vs ROA • We can make the case that both tell us the same thing, but that is not necessarily true as ROA tends to be the more volatile ratio. • ROE measures the return for $ invested by the shareholders. • ROA measures the same thing but over the entire asset base not just Equity. • In general, an ROA greater than the ROE is a sign of trouble. • Remember that ROA includes the cost of financing. If ROA is greater than ROE, it means that financing is costing more than it makes.
ROI - perspectives • ROE measures how much a company has earned on the funds invested by its shareholders (shareholder perspective) • ROA shows how well a company’s funds were used, irrespective of the relative magnitudes of the sources of these funds (current liabilities, debt and equity) • ROCE shows how much a company has earned on invested long-term funds (permanently employed capital = equity + LT debt)