Download
1 / 42
460 likes | 661 Views
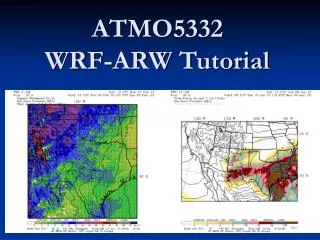
Multiple-Scale Visualization and Modeling of Biological Networks/Pathways. Zhenjun Hu Bioinformatics Program, Boston University, Boston, MA02215 http://visant.bu.edu. Outlines. Multiscale visualization & modeling using metagraph Distinguished features of biological networks

E N D
Multiple-Scale Visualization and Modeling of Biological Networks/Pathways Zhenjun Hu Bioinformatics Program, Boston University, Boston, MA02215 http://visant.bu.edu
Outlines • Multiscale visualization & modeling using metagraph • Distinguished features of biological networks • Handling large-scale networks • Advanced graphs & multiscale visualization & modeling • Existing compound graph • Metagraph: an extension of compound graph, or an alternative of hypergraph that can be used for pictorial representation. • Metagraph for pathway visualization • Hierarchical visualization, integration & modeling • Potential applications of metagraph for social networks
Why networks Circuit diagrams for biological networks ? The enthusiasm of the biological networks probably comes from the successful stories of the circuit diagrams in electronics. An early stored-program computer (left), built around 1950, used vacuum tubes in logic circuits, whereas modern computers use transistors and silicon wafers (right), but both are based on the same principles. Hartwell LH, Hopfield JJ, Leibler S et al. From molecular to modular cell biology, Nature 1999;402:C47-52
Why graphs Circuit diagrams for biological networks ? Tools for mining and visualizing cell systems has moved beyond static pictures of networks and links, most of them are based on the types of graphs listed below: Simple graph: contains no self-loops or multiple edges between pairs of nodes. Multigraph: Allows multiple edges between pairs of nodes. Compound graph: Integrates both adjacency relations (correlations between pairs of nodes) and inclusion relations among nodes (that is, simple nodes within a larger ‘compound’ node such as the ellipse around the simple nodes, A and B). Compound nodes cannot intersect one another When knowledge is integrated: simple graph multigraph/hybrid graph compound graph
What features a biological network However, there are fundamental differences between biological networks and logic circuits: Scale: There are thousands of biomolecules, such as genes, RNAs, and proteins, each may have different states. Abstract: Each node represents thousands of copies of the same biomolecule. Dynamic: The biological networks are changing dynamically, components may appear or disappear under certain condition. (Modular): Biological networks may have a modular nature, and may organized in a hierarchical structure.
Handling large-scale networks There are two key aspects need to be addressed when handling large-scale networks: • System performance. • Memory handling • Right data structure • Avoid nice drawing • Compact size • Batch mode • Network readability. • Better zooming/layout? • Not much we can do?
Handling large-scale networks Batch mode. This mode reads instructions from a command file, and process the requests without any visual interface and user interactions, which enables VisANT to run in the background ( http://visant.bu.edu/vmanual/cmd.htm ). • Command to run (assume the command file is located under res directory and the name is “batch_cmd.txt”): java -Xmx512M -Djava.awt.headless=true -jar VisAnt.jar -b res/batch_cmd.txt • Sample input/output:
Handling large-scale networks A functional linkage network with 15,447 nodes and 1,722,708 edges and laid out using elegant-->spring-embedded relaxing, as shown at right. The data of the network is downloaded from http://www.functionalnet.org/mousenet/ and directly loaded into VisANT on a duocore computer with 2G memory and win XP. Be aware that we specified the maximum memory size that are available on the test machine in the run.cmd: 1424M, which may not be required by this network and you can therefore reduce it in case necessary. In addition, VisANT can now directly read the zip file therefore the downloaded data is zipped. It takes 5+ hours for the test case to finish
Handling large-scale networks • So far we have discussed the solutions to improve system performance using the methods of the software engineering. But there seems no good solution to improve the network readability. • We will discuss how to use the advanced graph to improve the network readability and system performance by integrating more biological information An interaction network with 5489 nodes and 29,983 edges (Y2H:blue and Phylo: green)
Advanced graphs & multiscale visualization & modeling How geographical map zooms Countries States … TX MA Cities Blocks
Advanced graphs & multiscale visualization & modeling Semantic zooming vs. geometric zooming • Geometric (standard) zooming: The view depends on the physical properties of what is being viewed, objects change only their size. • Semantic zooming: Different representations for different spatial scales. The objects being viewed can additionally change shape, details (not merely size of existing details) or, indeed, their very presence in the display, with objects appearing/disappearing according to the context of the map at hand. • Biological network is much more complicatedthan geological maps
A B H C G M K D E F A H B G C M K D E F Advanced graphs & multiscale visualization & modeling Behind the scenes: compound graph= inclusive tree + adjacency graph A H B G C M inclusive tree K D E F adjacency graph Sugiyama, K. & Misue, K. Visualization of structure information: Automatic drawing of compound digraphs. IEEE Trans. Systems, Man, and Cybernetics 21, 876-892 (1991).
A H B G C M K D E F Advanced graphs & multiscale visualization & modeling Compound graph continued. A H B G C M K D E F • Two restrictions • No intersection between groups • An rooted inclusive tree Sugiyama, K. & Misue, K. Visualization of structure information: Automatic drawing of compound digraphs. IEEE Trans. Systems, Man, and Cybernetics 21, 876-892 (1991).
Advanced graphs & multiscale visualization & modeling • Except the leaf node, each node in the inclusive tree can be thought as a group containing nodes of next detail level. From the point view of biological networks, such group can be a functional module, a protein complex etc. • And a biological network seems have a modular structure:
Advanced graphs & multiscale visualization & modeling And life complexity seems hierarchical Oltvai, Z.N. & Barabasi, A.L. Systems biology. Life’s complexity pyramid. Science 298,763–764 (2002).
Advanced graphs & multiscale visualization & modeling And metabolic network seems to have a hierarchical organization Ravasz, E., Somera, A.L., Mongru, D.A., Oltvai, Z.N. & Barabasi, A.L. Hierarchical organization of modularity in metabolic networks. Science 297, 1551–1555 (2002).
Advanced graphs & multiscale visualization & modeling It seems that we can use compound graph to turn a “hair ball” of interaction network into a much readable network of functional modules: Tucker, C.L., J.F. Gera, and P. Uetz, Towards an understanding of complex protein networks. Trends Cell Biol, 2001. 11(3): p. 102-6
Advanced graphs & multiscale visualization & modeling • However, biological modules usually overlaps, because biomolecules usually play multiple roles. But compound graph does not support overlapping between groups • But why the complicated circuit diagram in electronics does not have overlapping problem? A biological network is an abstract network
Advanced graphs & multiscale visualization & modeling • Metagraph definition Hu Z, Mellor J, Wu J et al. Towards zoomable multidimensional maps of the cell, Nat Biotechnol 2007;25:547-554
Advanced graphs & multiscale visualization & modeling Expanded Collapsed • Metanode definition A B C Hu Z, Mellor J, Wu J et al. Towards zoomable multidimensional maps of the cell, Nat Biotechnol 2007;25:547-554
Advanced graphs & multiscale visualization & modeling • Metaedge definition: transient Hu Z, Mellor J, Wu J et al. Towards zoomable multidimensional maps of the cell, Nat Biotechnol 2007;25:547-554
B E I G2 H C A G1 G2 G4 F G C G3 I IV II III E I G1 G2 G2 H A G1 G4 F G3 G C G3 Advanced graphs & multiscale visualization & modeling • Metagraph illustration Illustration of the dynamics of meta graph. (I) An eight gene network grouped into three metanodes (G1, G2, G3), each containing a set of genes that subserve some common function. The idea that a node, such as C, is known to participate in more than one function at a given level, is represented by displaying it in more than one metanode. Three meta-nodes are in expanded state and their internal network structure is visible. (II) Meta-node G2 is collapsed and three meta-edges H_G2 (=H_B), E_G2 (=E_B) and C_G2 are created based on the original network connectivity. Meta-edge C_G2 is a special edge because it represents the shared components and rendered using a dashed line. (III) Both G1 and G2 are collapsed, three meta-edges are created, with G1_G2=E_G2 + H_G2, G1_G3=A_G and G3_G3=C_G2. It has also been shown here that meta-node can be embedded, with G1 and G3 embedded in a new meta-node G4. (IV) meta-node G4 collapsed, with a new meta-edge G4_G2=G1_G2+G3_G2. The procedures between I, II, III and IV are reversible. This might be best explained in terms of GO levels. For example G1, G2 and G3 might be GO level 10 (pathway level) whereas G4 is GO level 9 etc.
Advanced graphs & multiscale visualization & modeling An example to use metagraph to improve the readability and performance Total: 5,321 nodes and 33,992 edges
An example to use metagraph to improve the readability and performance (continued) Advanced graphs & multiscale visualization & modeling Total: 5,321 nodes and 33,992 edges
Advanced graphs & multiscale visualization & modeling An example to use metagraph to improve the readability and performance (continued) Total: 5,321 nodes and 33,992 edges
Metagraph for pathway visualization • Metagraph application in pathway visualization C KEGG Pathway Diagram (part of G1 phase of cell cycle) A B Complex Hierarchy E
Metagraph for pathway visualization • Metagraph application in pathway visualization (continued) Improved readability and performance with multi-scale I information integrated in pathway visualization using metagraph. Blue boxes represent the KEGG pathways; blue boxes with dark border are contracted metanodes representing a group of proteins; orange boxes with light border representing the protein complex, filled circles represent protein and open circles represent compounds. (I) Five signaling pathways of Homo sapiens visualized using metagraph, dashed lines indicate that there are shared nodes. (II) Same number of pathways visualized as an interaction network. The size of the node is reduced to improve the readability. I II Hu Z, Snitkin ES, DeLisi C. VisANT: an integrative framework for networks in systems biology, Brief Bioinform 2008;9:317-325
Metagraph for pathway visualization • Condition dependency Hu Z, Snitkin ES, DeLisi C. VisANT: an integrative framework for networks in systems biology, Brief Bioinform 2008;9:317-325
Hierarchical visualization, integration & modeling Level 4 Level 3 • Metagraph application: visualization of the network hierarchy Module of level 3 Level 1 Level 2 Protein of level 4 Level 1: 1 module Level 2: 8 modules Level 3: 161 modules Level 4: 810 proteins. Only part of proteins are shown in the figure due to space limit. Hu Z, Mellor J, Wu J et al. Towards zoomable multidimensional maps of the cell, Nat Biotechnol 2007;25:547-554
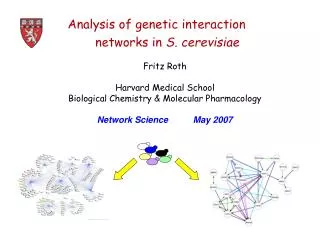
Hierarchical visualization, integration & modeling • Metagraph application: integrating interaction network with GO hierarchical modules A B sequence-specific DNA binding 0(+34) genes centromeric DNA binding 6 genes rDNA Binding 6 genes AT DNA Binding 3 genes telomeric DNA Binding 9 genes DNA replication origin binding 10 genes C D Hu Z, Mellor J, Wu J et al. Towards zoomable multidimensional maps of the cell, Nat Biotechnol 2007;25:547-554
Hierarchical visualization, integration & modeling • Metagraph application: network of protein complexes Gavin, A.C. et al. Functional organization of the yeast proteome by systematic analysis of protein complexes. Nature 415, 141–147 (2002).
Hierarchical visualization, integration & modeling • Metagraph application: network of protein complexes integrated with Y2H interactions
Hierarchical visualization, integration & modeling • bottom-up modeling: cancer network Goh KI, Cusick ME, Valle D et al. The human disease network, Proc Natl Acad Sci U S A 2007;104:8685-8690.
Hierarchical visualization, integration & modeling • top-down modeling: disease networkcancer gene network Goh KI, Cusick ME, Valle D et al. The human disease network, Proc Natl Acad Sci U S A 2007;104:8685-8690.
Quick summary • Metagraph improves the network readability and system performance with integrated context information. • Metagraph helps to represent the complication of the biological network, such as condition-dependency, combinatory control etc. • Metagraph extends the system’s capability to integrate multiscale knowledge, making it much more practical to model/simulate the complexity of biological system: from cell to functional module, network motif, protein…
Metagraph: potential application in social network • Science of Science and Innovation Policy (SciSIP)
Metagraph: potential application in social network • What can be expected from SciSIP? • Predict potential research innovation • Predict potential new cross-discipline research fields • Predict potential collaboration between different research scientists • and more ……
Metagraph: potential application in social network • Let’s model each paper (blue) as a metanode with authors (red) as its components and then we get a network of publications: Expression Analysis Sequence Alignment A collaboration network between different research fields Pathway Analysis Biomarker Detection
Metagraph: potential application in social network • Let’s turn the publication network into co-author network: More importantly, an author can also be modeled as a metanode with educations, hobbies etc. as the subcomponents, which will enable us to draw the correlations from heterogeneous data
Charles DeLisi Acknowledge Part of the support funding come from NIH & Pfizer