Download
1 / 56
1.43k likes | 3.38k Views
สถิติ เบื้องต้น Statistics. สถิติคืออะไร. เทคนิคในการรวบรวม วิเคราะห์ ตีความข้อมูล เป็นเครื่องมือของการวิจัยที่อาศัยการวิเคราะห์ข้อมูลเป็นหลัก. Scale of Measurement. Nominal Scale (นามบัญญัติ) (เช่น ชาย, หญิง วิเคราะห์โดย Mode, Frequency)

E N D
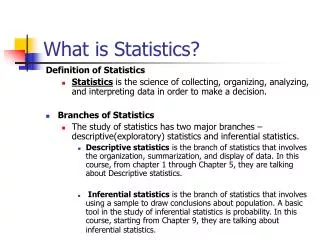
สถิติคืออะไร • เทคนิคในการรวบรวม วิเคราะห์ ตีความข้อมูล • เป็นเครื่องมือของการวิจัยที่อาศัยการวิเคราะห์ข้อมูลเป็นหลัก
Scale of Measurement • Nominal Scale(นามบัญญัติ) (เช่น ชาย, หญิง วิเคราะห์โดย Mode, Frequency) • Ordinal Scale(เรียงอันดับ)(เช่น คะแนน Grade A, B, C) • Interval Scale(ช่วง หรือ อันตรภาค)(arbitrary zero, ระยะห่างของแต่ละหน่วยเท่าๆกัน หาค่าเฉลี่ยได้ เช่น องศาเซลเซียส, ฟาเรนไฮต์) • Ratio Scale(อัตราส่วน) (true zero) น้ำหนัก, รายได้
ประเภทของสถิติ สถิติเชิงอนุมาน สถิติเชิงพรรณนา Mean Mode Median Variance SD Non Parametric Parametric t-test ANOVA ANCOVA Factor Analysis Pearson’s Nominal Ordinal Spearman Mann-Whitney Chi Square Median Test Sign Test
สถิติเชิงพรรณนา, สถิติเชิงอนุมาน • สถิติเชิงพรรณา (Descriptive Statistics) ใช้กับกลุ่มประชากร ได้แก่ Mean, Mode, Median, Variance,Standard Deviation เป็นต้น • สถิติเชิงอนุมาน (Inference Statistics) เป็นสถิติเชิงทดสอบสมมุติฐาน ว่าสมมติฐานที่ตั้งไว้เป็นจริงหรือไม่ ได้แก่การประเมินค่าพารามิเตอร์ในประชากร (Estimation) และการทดสอบสมมุติฐาน (Hypothesis Testing) แบ่งออกเป็น Parametric และ Non parametric statistics
ประเภทของสถิติ Geometric Mean Coefficient of Variation RATIO INTERVAL ORDINAL NOMINAL Parametric Median, Percentile Spearman Kendall, Kendall W Non-Parametric Mode, Frequency Contingency Coefficient
Parametric Statistics • กลุ่มประชากรที่มีการแจกแจงแบบโค้งปกติ ข้อมูลทั้งหมดเรียกว่า Population ค่าที่คำนวณได้เรียก Parameter แต่ถ้าเก็บมาเพียงบางส่วนจากประชากรจะเรียก Sample ค่าที่ได้เรียกว่าค่าสถิติ (Statistics) มี Scale แบบ Ratio หรือ Interval scale เช่น t-test, ANOVA, Correlation, Multiple Regression เป็นต้น
Non Parametric Statistics • คือสถิติที่ใช้กับกลุ่มประชากรที่ไม่เข้าเงื่อนไขของ Parametric มี Scale การวัดแบบ Ordinal และ Nominal เช่นใช้วิธี Chi Square, Log Rank Test, Mann Whitney, Wilcoxon เป็นต้น
สมมติฐานการวิจัย Research Hypothesisสมมติฐานทางสถิติ Statistical Hypothesis • สมมติฐานการวิจัย คือ การคาดการณ์ผลวิจัย • สมมติฐานทางสถิติ คือ H0 และH1 • Null Hypothesis = H0มักเขียนในรูปปฏิเสธหรือไม่มีความแตกต่าง ไม่สัมพันธ์กัน • Alternative Hypothesis = H1 มักเขียนในรูปมีความแตกต่าง มีความสัมพันธ์กันและเขียนให้สอดคล้องกับสมมติฐานการวิจัย
p value • ยิ่ง p value ยิ่งมีค่าน้อยก็จะเลื่อนไปทางด้านหางของ H0 จึงปฏิเสธ H0 หรือก็คือเลื่อนเข้าไปใน H1 มากขึ้นจึงยอมรับ H1 ซึ่งสอดคล้องกับสมมติฐานการวิจัย
Alpha and Beta errors THE TRUTH CONCLUSION drawn from analysis
Alpha and Beta errors • Alpha error = 0.05 หรือ 5% ความเชื่อถือได้ 95% = 1-a, Confidence Intervalหรือ = 0.01 หรือ 1 % (ความเชื่อถือได้ 99%) เรียกว่าระดับนัยสำคัญ • Beta error = 20% (power of test = 1-b)
Z distribution • โค้งเริ่มที่ – Infinity ไปถึง + Infinity • Mean=0, SD=1
student’s distribution sample < 30 T distribution= A symmetric distribution with mean zero and a standard deviation larger than that for the normal distribution for small sample sizes. As n increase t distribution approaches the normal distribution. t distribution
F distribution • A continuous statistical distribution which arises in the testing of whether two observed samples have the same variance. • F distribution=The probability distribution used to test the the equality of two estimates of the variance. • It is the distribution use with the F-test in ANOVA
การกระจายค่า z และพื้นที่ใต้โค้ง
95% Confidence Interval 95% C.I. = Mean + 2 SD
Chi Square Distributionสำหรับตัวเลขจาการนับ (Counted) • โค้งเริ่มที่ 0 ไปที่ + Infinity มีค่าเป็นบวกเสมอ • ที่ df=1 a=0.05 Chi Square= 3.84 • ถ้า P < 0.05 จะยอมรับ Ha • ถ้า c2 > 3.84 จะยอมรับ Ha
Chi Square • Tests the hypothesis that the row and column variables are independent, without indicating strength or direction of the relationship. • ตรวจสอบว่าต่างกันหรือไม่แต่ไม่บอกว่าต่างกันมากน้อยเท่าไรและไม่บอกว่ามากกว่าหรือน้อยกว่า(เงื่อนไข Row และ Column เป็นอิสระต่อกัน)
Chi-Square Tableหาความสัมพันธ์ Crosstab ป่วย ไม่ป่วย Exposure + Exposure - • ที่ df=1 a=0.05 Chi Square= 3.84 • degree of freedom (df) = (Row-1)x(Column-1) • เช่น ตาราง Contingency table (2x2 table) มี df=1
Chi-Square Observed1, Observed2วิเคราะห์ว่าต่างกันหรือไม่ • Ho : Observed1 และ Observed2 ไม่ต่างกัน • Ha : Observed1 และ Observed2 ต่างกัน • Expected=(O1+O2)/2 • ที่ df=1 a = 0.05 Chi Square= 3.84 • ถ้า p value < 0.05 หรือถ้า c2 > 3.84 จะยอมรับ Ha (O-E)2 E c2= S
Chi-Square วิเคราะห์ความสัมพันธ์ ของ 2x2 table (Crosstabs) ป่วย ไม่ป่วย รวม • c2 = n (ad-bc)2 efgh Exposure + Exposure - รวม Ho : Exposureและการป่วยไม่สัมพันธ์กัน Ha : Exposureและการป่วยสัมพันธ์กัน ที่ df=1 a= 0.05 Chi Square = 3.84 ถ้า p value < 0.05 หรือ ถ้า c2 > 3.84 จะยอมรับ Ha
t-test • The statistical test for comparing a mean with a norm or for comparing two means with small sample size (n =<30). • It is also use for testing whether a correlation coefficient or a regression coefficient is zero.
การเปรียบเทียบค่าเฉลี่ย 2 กลุ่มตัวอย่าง Mean1 = 5.6 Mean2 = 5.1 Variance = 10 Variance = 12 Sample Size = 30 Sample Size = 100 เช่น Mean1 จะเท่ากับ Mean2 หรือไม่ t-test
ประเภทของ t-test Means t-test 1 กลุ่ม Population 2 กลุ่ม One Sample มีความสัมพันธ์กัน เป็นอิสระต่อกัน Paired t-test t-test Group
The One-Sample t Test • procedure tests whether the mean of a single variable differs from a specified constant.
The Paired-Samples t Test • procedure compares the means of two variables for a single group. It computes the differences between values of the two variables for each case and tests whether the average differs from 0.
The Independent-Samples t-Test • procedure compares means for two groups of cases. Ideally, for this test, the subjects should be randomly assigned to two groups, so that any difference in response is due to the treatment (or lack of treatment) and not to other factors.
Positive Association Negative Association Associationr = Correlation Coefficient No Association Except Non-Linear r = +1 r = -1 r = 0 . . . . . . . . . . . . . . . . . . . . .
Associationr = Correlation Coefficient x และ y มีความสัมพันธ์ในรูปพาราโบลา y . . . . . . . . . . . แม้ว่า slope = 0 x และ y ก็ยังมีความสัมพันธ์ กันได้ Mathematics Relationship x
ความลาดของเส้นถดถอย slope=a intercept=b y a y = ax+b b x 0
r = สัมประสิทธิ์สหสัมพันธ์ • r เป็นบวกแสดงว่า x เพิ่ม y จะเพิ่ม ถ้า x ลด y จะลดด้วย • r เป็นลบแสดงว่า x เพิ่ม y จะลด ถ้า x ลด y จะเพิ่ม • r เข้าใกล้ 1 แสดงว่า x และ y มีความสัมพันธ์ทิศทางเดียวกันและมีความสัมพันธ์กันมาก • r = 0 แสดงว่า x และ y ไม่มีความสัมพันธ์กันเลย (ยกเว้น Non-Linear)
r จะบอกความสัมพันธ์ดังนี้ • r = 0.8-1.0 มีความสัมพันธ์กันมาก • r = 0.5-0.8 มีความสัมพันธ์กันปานกลาง • r = 0.2-0.5 มีความสัมพันธ์กันน้อย • r = 0-0.2 ไม่ควรสนใจกับความสัมพันธ์นี้
r Square • r2 ไม่มีหน่วย • ถ้า r2 มีค่าเข้าใกล้ 1 แสดงว่าเปอเซนต์ที่ x สามารถอธิบายการเปลี่ยนของ y มีค่ามาก • ถ้า r2 มีค่าเข้าใกล้ 0 แสดงว่าเปอเซนต์ที่ x สามารถอธิบายการเปลี่ยนของ y มีค่าน้อย
ความถดถอยชนิดอื่นๆ ที่ไม่ใช่เส้นตรง • Polynomial Regressiony=a+bx+cx2+dx3+... • Multiple Regressiony=a+ b1x1 + b2x2 + b3x3 +…+bnxn • Non-Linear Regressiony=acbx • Sigmoid Curves
ตัวแปร • ข้อมูลได้จากการสังเกต วัด สอบถาม หน่วยศึกษาอาจเป็นคน สัตว์ สิ่งของ • ตัวแปรแตกต่างกันเพราะ • คุณลักษณะแตกต่างกัน • เวลาแตกต่างกัน • สถานที่แตกต่างกัน
ประเภทของข้อมูล • แบ่งตามที่มา • ข้อมูลปฐมภูมิ (Primary Data) • ข้อมูลทุติยภูมิ (Secondary Data)
ข้อมูลเชิงคุณภาพ อยู่รูปแบบของข้อความ เช่น เชื้อชาติ เพศ สีผิว Qualitative Variables Categorical Variables Nominal Variables Ordered Variables Coded Variable ข้อมูลเชิงปริมาณ ได้จากการชั่ง ตวง วัด เช่น น้ำหนัก ความดันโลหิต Quantitative Variable 1. Discrete Data เช่นจำนวนสิ่งของ จำนวนคน 2. Continuous Data เช่น น้ำหนัก ความกว้าง ข้อมูลเชิงคุณภาพและข้อมูลเชิงปริมาณ
ข้อมูลเชิงคุณภาพ • ชาย 30 คน หญิง 30 คน • เป็นข้อมูลได้จากการนับ • สูบบุหรี่ 15 คน ไม่สูบบุหรี่ 45 คน • เป็นข้อมูลได้จากการนับ
ข้อมูลเชิงคุณภาพ • ความเห็นต่อการให้บริการของศูนย์คอมพิวเตอร์
ข้อมูลเชิงคุณภาพ-->ข้อมูลเชิงปริมาณข้อมูลเชิงคุณภาพ-->ข้อมูลเชิงปริมาณ • แต่ถ้ารวมกันเป็น 3 ตาราง • ความเห็นต่อการให้บริการของศูนย์คอมพิวเตอร์ • ความเห็นต่อการให้บริการของศูนย์ข้อมูล • ความเห็นต่อการให้บริการของศูนย์พิมพ์ • ต่ำสุด = 3 สูงสุด = 15อาจจัดเป็นข้อมูลเชิงปริมาณ
ข้อมูลเชิงปริมาณ-->ข้อมูลเชิงคุณภาพข้อมูลเชิงปริมาณ-->ข้อมูลเชิงคุณภาพ • วัดส่วนสูง = 149 155.5 160 167 169 170.5 172 • เป็นข้อมูลเชิงปริมาณ • แต่ถ้าจัดกลุ่มให้ <150 = เตี้ย • 150-170=ปานกลาง • >170=สูง • เตี้ย ปานกลาง สูง จำนวนอย่างละกี่คน ? เป็นข้อมูลเชิงคุณภาพ • รายละเอียดของข้อมูลจะสูญเสียไป • จาก Ratio Scale เปลี่ยนเป็น Ordinal Scale
การวิเคราะห์ความสัมพันธ์การวิเคราะห์ความสัมพันธ์
เปรียบเทียบ หรือ หาความสัมพันธ์ • เปรียบเทียบ 2 ประชากร / ตัวแปร • ความสัมพันธ์ 2 ประชากร / ตัวแปร • ตัวแปรเชิงปริมาณใช้ ค่าเฉลี่ย • ตัวแปรเชิงคุณภาพใช้ ค่าสัดส่วน