Download
1 / 9
90 likes | 194 Views
Compound F Derivatives:. F. F1. F2. F3. F4. F5. F6. F7. F8. Compound H Derivatives:. H. H1. H2. H3. H4. H5. H6. H7. H8. Compound N Derivatives:. N. N1. N2.

E N D
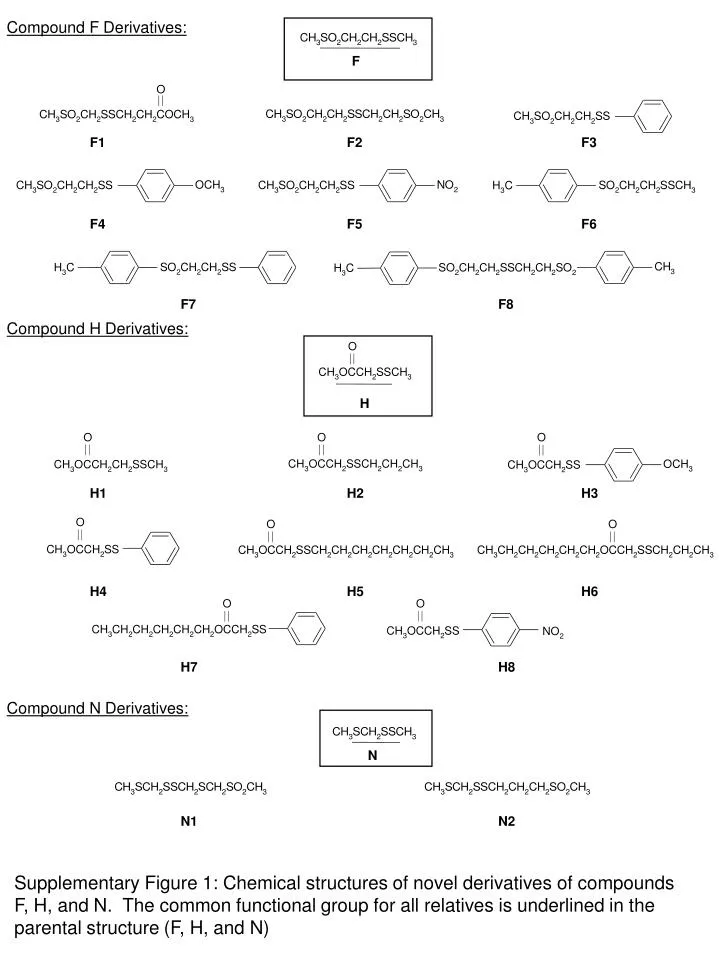
Compound F Derivatives: F F1 F2 F3 F4 F5 F6 F7 F8 Compound H Derivatives: H H1 H2 H3 H4 H5 H6 H7 H8 Compound N Derivatives: N N1 N2 Supplementary Figure 1: Chemical structures of novel derivatives of compounds F, H, and N. The common functional group for all relatives is underlined in the parental structure (F, H, and N)
B) A) Supplementary Figure 2: The extent of apoptosis induced by each OSC was determined using two techniques, Fixed-PI and TUNE, in normal diploid (WI38) and leukemic (AML-3 and KK) cells. (A) The mean percentage of cells staining in pre-G1 region (apoptotic) was determined for KK and WI38 cells. The ratio of these two values for each OSC is a proxy for their therapeutic ratio. A similar analysis was performed for AML-3 cells (Figure 2A). (B) The mean percentage of cells staining TUNEL positive (apoptotic) was determined for each OSC in both AML-3 and WI38 cells. The ratio of these two values is a proxy for their therapeutic ratio. A similar analysis was performed for KK cells (Figure 2B).
Red Green A) Raw Norm B) C) Supplementary Figure 3: (A) Boxplots of raw and normalized signal intensity for the red and green channels of the microarray data. Normalization increases distributional similarity. (B) & (C) Gaussian densities of the red and green channel intensities from the microarray data before (B) and after (C) normalization. Normalization increased the inter-experiment homogeneity.
Supplementary Figure 4: Array data was pre-processed using the VSN algorithm and then each compound was tested for differential expression relative to the acetone control using a general linear model. Genes were selected using an F-test of this model at a threshold of p < 10-3 and subjected to divisive hierarchical clustering using the DIANA algorithm.
Supplementary Figure 5: Array data was pre-processed using the VSN algorithm and then each compound was tested for differential expression relative to the acetone control using a general linear model. Genes were selected using an F-test of this model at a threshold of p < 10-6 and subjected to divisive hierarchical clustering using the DIANA algorithm.
Supplementary Figure 6: Array data was pre-processed using the VSN algorithm and then each compound was tested for differential expression relative to the acetone control using a general linear model. Genes were selected using an F-test of this model at a threshold of p < 10-9 and subjected to divisive hierarchical clustering using the DIANA algorithm.
Supplementary Figure 7: Following VSN pre-processing, genes whose mRNA levels were altered by each compound relative to acetone control were identified using a general linear model at padjusted < 0.05 and subjected to GO enrichment analysis. The log10|P| values from this GO analysis were extracted and GO terms showing Pcumulative < 10-5 were subjected to divisive hierarchical clustering using the DIANA algorithm.
Supplementary Figure 8: Following VSN pre-processing, genes whose mRNA levels were altered by each compound relative to acetone control were identified using a general linear model at padjusted < 0.05 and subjected to GO enrichment analysis. The log10|P| values from this GO analysis were extracted and GO terms showing Pcumulative < 10-7.5 were subjected to divisive hierarchical clustering using the DIANA algorithm.
Supplementary Figure 9: Following VSN pre-processing, genes whose mRNA levels were altered by each compound relative to acetone control were identified using a general linear model at padjusted < 0.05 and subjected to GO enrichment analysis. The log10|P| values from this GO analysis were extracted and GO terms showing Pcumulative < 10-12.5 were subjected to divisive hierarchical clustering using the DIANA algorithm.